IR Scope and IR Widget User's Guide
A PDF form of this topic can be found here[1],
Documentation written by Vicky, Tommy Tyler and Graham Dixon
Contents |
INTRODUCTION
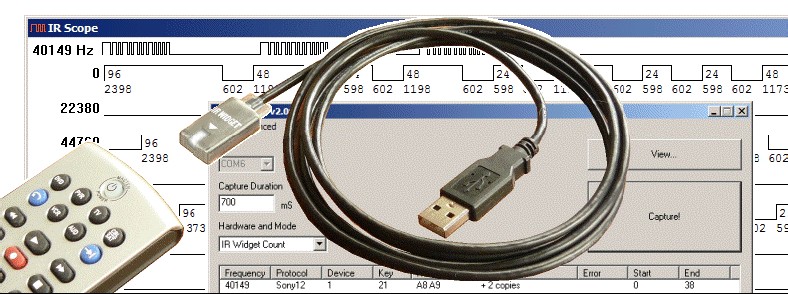
The IR Widget is a tool for recording signals transmitted from infrared remote controls. Its small optical detector probe is placed a few inches in front of a remote to capture the output signal. The Widget works by counting individual pulses of the remote's infrared LED. It measures carrier frequency and ON/OFF times of carrier bursts with very good accuracy. A Widget has the capacity to capture and display an almost unlimited number of records 1/2 second to 15 seconds in length.
IRScope is the software that collects and displays the data from the Widget. IRScope provides a graphic display, similar to that of a digital storage oscilloscope, showing precise timing details of the signal. IRScope’s built-in decoder provides a complete descriptive analysis if the signal pattern is recognized. Graphic displays are drawn to exact scale, and can be zoomed, stretched, dragged, scrolled, and saved. IRScope and an IR Widget are great tools for studying infrared signals. The IR Widget and IRScope were designed by Kevin Timmerman. Tommy Tyler enhanced the design and sells them. You can find Tommy Tyler's Store in the market place in the JP1 site. Graham Dixon (mathdon) took over development of IRScope and made some exciting enhancements that make the software a fantastic tool for anyone studying signals, even if they have not purchased a Widget.
There are many ways to capture a signal for analysis. For instance, a JP1 user with a learning remote and interface cable, can capture signals with the remote and read them in via IR or RMIR. Many people find that procedure cumbersome. With a Widget, you can avoid the frustration of collecting learns in batches, the hassle of botched learns, and the confusion of figuring out what you put where. A Widget can learn virtually all signals. Some signals are too complicated to be analyzed and stored by a JP1 remote, but a Widget doesn’t have these shortcomings.
The Widget is an economical solution. It is a bargain when compared to other oscilloscope solutions. The Widget can be less expensive than purchasing a learning remote with a cable for data collection too. The Widget is an IR collection tool; it doesn’t function as a remote. That is the one place where the JP1 remote with interface cable does have a huge advantage. You can use the learning remote to record the signals, and have a pretty cool remote that you can program with your PC using the JP1 tools. For a serious enthusiast, I’d recommend having both the Widget and a learning remote with cable interface!
IRScope’s oscilloscope type representation of the infrared signal’s timing data can be very helpful when learning about infrared protocols. IRScope can acquire timing data from several different sources. This makes the software helpful even without a Widget. The signal can be captured by the Widget or the signals can be imported from UEI (JP1) remote type learns, Pronto type learns or raw timing data. IRScope provides a large variety of output. Signal information can be saved in IRScope’s .ict (Infrared Capture Text) files; the information can be exported as UEI learns, Pronto learns, Lintronic forms; and detailed Summary reports. 2 IRScope’s creates and reads .ict (Infrared Capture Text). Originally these files only recorded a single capture. Two of the new features that Graham has added, (allowing notes and saving multiple signals from several capture sessions in a single ict file), make ICT files a convenient way of documenting and organizing signal information. An ICT file holds all the timing data and any notes entered while collecting signals. The decode data is not saved in the ICT file; the signal is decoded each time the ICT file is opened. This method allows ICT decodes to be improved when new versions of decodeIR.dll become available. DecodeIR.dll is the decoder used with all the JP1 tools such as IR, RMIR, DecodeCCF and IRTool.
IRScope is a powerful diagnostic tool. It is always nice to be able to see what is coming out of the remote. The waveform allows you to visually compare signals to see if the OEM and upgrade signals match. It is very useful in diagnosing macro problems, such as duration problems or programming errors. IRScope can also be useful in diagnosing a wide variety of upgrade issues.
SOFTWARE INSTALLATION
The IRScope software bundle contains everything except the Widget’s USB driver. IRScope can be downloaded from the File Section>Tools>Main in the JP1 forum.
The bundle includes:
- IRScope.exe
- DecodeIR.dll
- Features of IRScope version. xxx .pdf. a document that describes the new features
- DecodeIR.html a document that gives specifications for various protocols.
- MakeHex.dll
- ExchangeIR.dll
Unzip the download and place all six files in the same folder.
IRScope requires version DecodeIR.dll v2.39 (or later) that is supplied in the download package. Many of the JP1 tools use DecodeIR.dll, so you may have older versions on your PC. If you store your decodeIR.dll in a centralized Windows System folder so that the applications share the same dll, make sure that your system is using decodeIR.dll version 2.39 or later.
IR WIDGET DRIVER INSTALLATION:
The Widget’s driver is not bundled with IRScope, the driver is downloaded separately.
The Widget requires version 2.04.06 (or later) of the FTDI USB driver. You can download version 2.06.00 from: http://www.ftdichip.com/Drivers/VCP.htm. If you have an older version in your PC (perhaps from using a USB JP1.2/3 (Flash) Interface) you must first uninstall it. You'll need a utility called CDMUninstallerGUI, which you can download from: http://www.ftdichip.com/Resources/Utilities.htm. The download includes a brief readme.html that explains how to use the uninstaller.
The first time you plug in a Widget after uninstalling old drivers, Windows' New Hardware Wizard will prompt you through new driver installation in two phases. First it installs a driver for the USB Serial Converter function of the Widget. Following that, it installs a driver for the USB Serial Port function of the Widget. To verify that your driver installation is successful, open Device Manager and expand both the Ports (COM & LPT) list and the Universal Serial Bus controllers list. When you plug in the Widget, a new entry called USB Serial Port (COMx) will appear at the end of the Ports list, and simultaneously a new entry called USB Serial Converter will appear at the end of the Universal Serial Bus controllers list, as shown in Figure 1 on the following page.
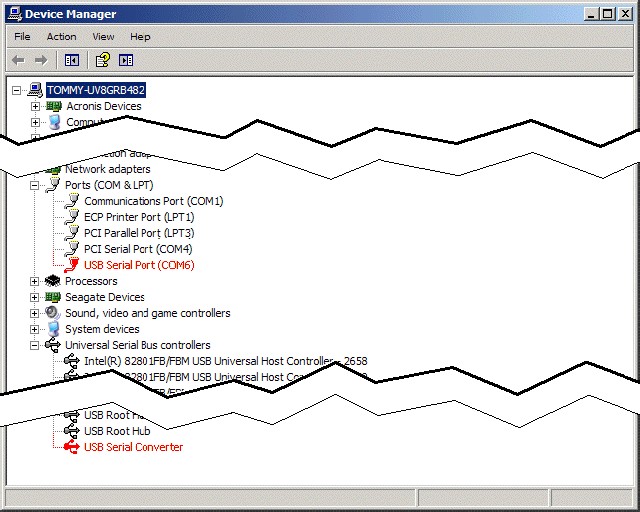
Figure 1. Device Manager Showing Typical Widget Device Recognition
IRScope should be able to Autodetect this port, but on some systems Autodetect does not work, and you may need to manually enter that COM port number in the Port field in IRScope’s main window.
EXPLORING THE MAIN SCREEN
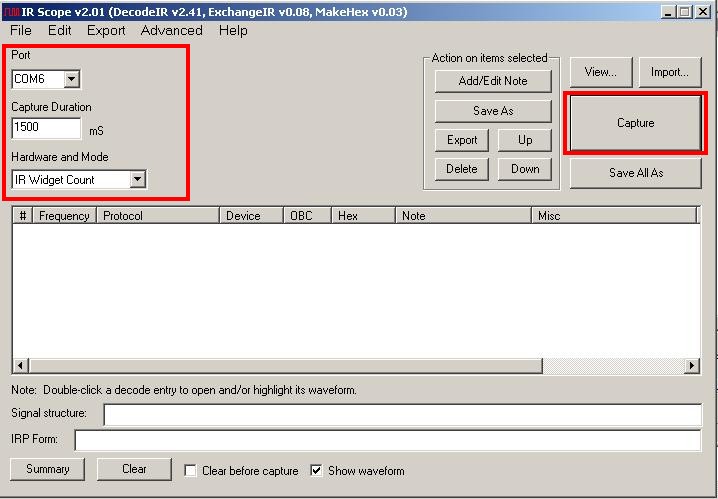
Capturing a Signal To capture a signal with your Widget, you will need to make sure the Port, Capture Duration and Hardware and Mode settings are set and then press the Capture button. Port A grayed-out Port box indicates that you cannot drop down the list of COM ports because IRScope has already found the correct USB port. However, if the Port number were enabled, as in Figure 2, it could mean that the AutoLocate feature is not working. In the Advanced menu make sure there is a check mark in front of AutoLocate Widget. Try closing and relaunching the program. If it still doesn’t automatically locate, manually find the COM port number in the device manger as you did when you verified your Widget driver installation. Type that COM number in the port field in IRScope’s main window. Capture Duration Shows the total length of a recording in milliseconds, starting when the Widget detects the beginning of a signal from the remote. The entry in this box must be an integer value between 500 and 15000 (1/2 second to 15 seconds). The default value of 700 mS is fine for capturing individual buttons, but must be increased to capture a macro. You will have 5 seconds to start sending a signal, and as soon as the signal is detected, IRScope will record infrared activity for the specified capture duration. Hardware and Mode When working with a Widget, ALWAYS leave this set on IR Widget Count! Capture Button The Capture button prepares the system to collect data. When you are all setup and ready to record a signal, click on Capture, point your remote at the Widget’s probe and press a remote button. If you wait longer than 5 seconds before starting transmission, the capture will abort with an error message. The default configuration is for the program to output an audible beep when you press Capture and start the five second clock. If you don't like beeps, check the Suppress Beeps option in the Advanced menu.
SHOW WAVE FORM
![]()
If the show waveform box was checked, a waveform window will appear when the capture is finished.
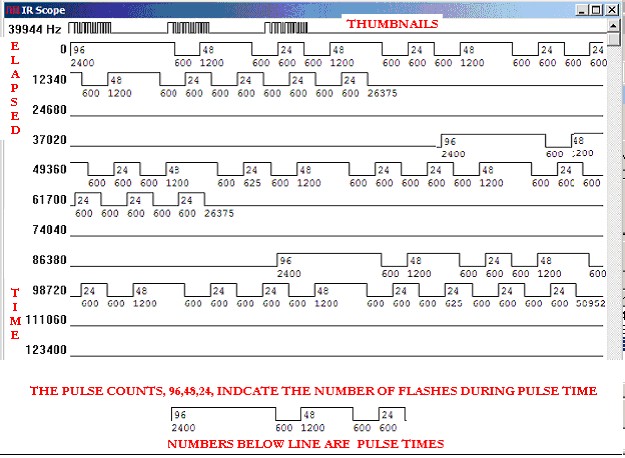
The waveform window is very useful in diagnosing problems, and creating custom protocols. The waveform in Figure 3 has been labeled to show what the various parts of a waveform represent. A brief description follows here. The Waveforms Explained section provides a more detailed description. The top line of the waveform windows shows thumbnails. There are three options to control how the thumbnail line will be displayed. Under the Advanced menu, Thumbnail Scale you have the option of Fixed Resolution, Limited Duration and Entire Waveform. You should choose a Thumbnail Scale that best suits your activity. The Frequency is in the upper corner. The frequency in Figure 3 is 39944hz. If a mixture of signals was captured, the frequency is not computed and instead < freq varies> is shown. Frequency is a measure of how many times the light flashed during the ON pulse time. The waveform is completely scalable. If the timings are so close that the numbers are unreadable, you can click on the form and change the number of microseconds per pixel. You can also remove the pulse counts, those pulse times or the elapsed times. The pulse times are the numbers below the line. You may be used to seeing pulse times with + and minus like +2400, -600, + 1200 –600 +600 when no waveform is available. The – was used to indicate the quite times, not to indicate a negative time. If you don’t want to see the waveform on each capture uncheck the show waveform option. 6
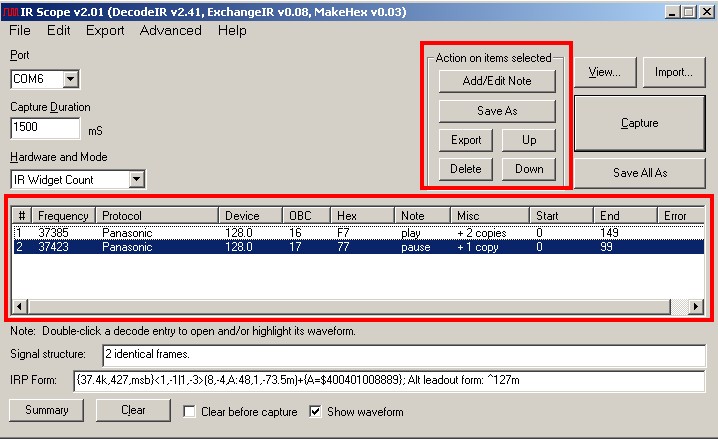
Figure 4. Decode Grid and Action on Items Selected box
Decode Grid
The decode grid shows a list of decodes for the recorded signals. The grid has 11 sizeable columns, #, Frequency, Protocol, Device, OBC, Hex, Note, Miss, Start, End and Error. Depending on how the columns have been sized, some columns may be hidden. The grid allows single or multiple signal selections. Double click on a selection to open and or highlight its waveform.
In Figure 4, the grid entries for the highlighted signal show:
- 2. This shows the position this signal holds in the grid and ict files.
Frequency 37423. This shows the relation ship of the pulse count to the pulse time. Protocol This shows which set of formatting rules the signal follows, in this case Panasonic. Device 128.0 indicates a device of 128, sub-device 0 (note a zero and a blank are not the same) OBC this is the function part of the signal. That is the part that changes with each key press. Note this information is input by the user. Hex codes for the specific button. NEVER USE THIS hex to create an upgrade. The hex you need to enter in RemoteMaster’s (RM) hex column may not match this hex! Misc describes the repetition characteristics of the signal and other miscellaneous information. No Repeat means the signal consisted of only one full frame. +N copies means the signal consisted of N+1 full frames. +N dittos means the signal consisted of one full frame followed by N ditto frames. Ditto frames consist of only a starting and ending burst but no data portion. Dittos frames are used to indicate that a button is being held down. Start and End the numbers in the columns refer to carrier ON bursts in a signal, and are used only by experts when debugging decoding errors. Error column is not used. Action on Items Selected Box All the buttons in this box work on the lines selected in the Decode Grid. Add/Edit Note allows a label to be entered on the selected grid line. Add/Edit Note is how the “pause” and “play” descriptions got into the Note column. UP and DOWN moves the selected signals in the decode grid. DELETE deletes the selected signals from the decode grid. EXPORT writes timing information in UEI Learns, Pronto Learns or Lintronic timing formats to a text file. See the Export menu and in the IRScope’s Output formats sections for more detailed information. SAVE AS saves the timing data for the selected signals in an ICT (Infrared Control Timing) file.

FIGURE 5. Signal structures and IRP Form
Signal Structure This gives general information about the selected signal. IRP Form: IRP notation is a way of describing the signal. The IRP Form displayed in IRScope is a generic IRP form. The portion shown as {A=} is a representation of the analyzed data portion of the signal. You can adjust the way A is displayed from the Advanced menu. If you want to understand the protocol rules, take a look at the official IRP for the protocol. To see the official IRP, select HELP and then select Interpreting Decoded IR Signals. Generic IRP Form. {37.4k,427,msb}<1,-1|1,-3>(8,-4,A:48,1,-73.5m)+{A=$400401008889}; Alt leadout form: ^127m The official IRP for the Panasonic code looks like this. {37k,432}<1,-1|1,-3>(8,-4,2:8,32:8,D:8,S:8,F:8,(D^S^F):8,1,-173)+ D is the device, S is the subdevice, and F is the OBC and the signal is lsb.

FIGURE 6. Clear and Clear before capture
CLEAR The clear button will immediately delete everything from the decode grid, to delete selected lines use the Delete in the Action on Items Selected area. Clear before Capture If this option is checked, the contents of the decode grid will be erased every time you capture a new signal.
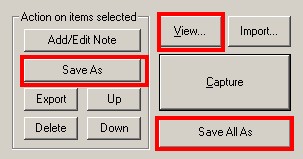
SAVE ALL AS
Save All As, will save an ICT (Infrared Capture Text) file, that will includes all the signals in the decode grid. The Save As only saves the highlighted signals. ICT files that have a complete signal set are very a very convenient way to pass information.
VIEW
The view button allows you to open an ICT file and adds all the information into the decode grid.
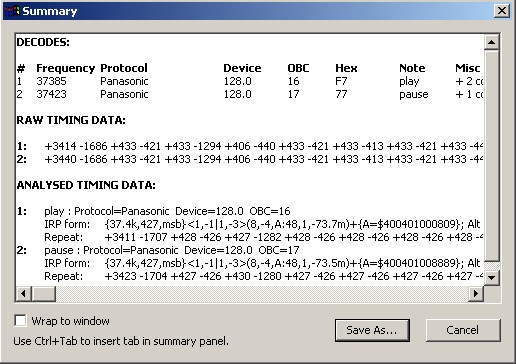
SUMMARY The summary button produces the report in figure 7. The DECODES portion of the report reproduces the decode grid from the main screen. This can be helpful if you need a hard copy to do your data entry in RM or KM. I like to copy and paste this data into a spreadsheet and manipulate it so that I don’t have to risk making data entry errors. The RAW TIMINGS DATA and ANALYSED TIMING DATA portions can be useful if the signals couldn’t be decoded because they didn’t follow the rules for any known protocol.
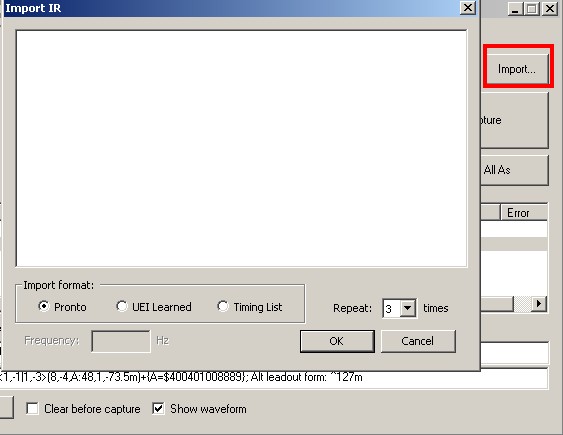
Figure 8, IRScope’s Import window
IMPORT
IRScope is also capable of importing signal in the form of Pronto Hex, Raw timing data and UEI learns. Select the import type; indicate the number of repeats to be displayed and paste the timing information into the area provided.
Pronto Hex is a form of timing data that is used in high end Philips remotes. This is a convenient way to exchange information about IR signals. Many manufacturers post data in Pronto Hex format. Pronto users exchange information via pronto hex and in CCF files and PCF files containing their configurations.
Pronto Hex looks like this.
0000 006C 0032 0000 0080 003C 0010 000F 0010 000F 0010 002F 0010 000F 0010 002F 0010 000F 0010 000F 0010 000F 0010 002F 0010 002F 0010 000F 0010 000F 0010 000F 0010 002F 0010 002F 0010 000F 0010 000F 0010 000F 0010 000F 0010 000F 0010 000F 0010 000F 0010 000F 0010 000F 0010 000F 0010 000F 0010 002F 0010 000F 0010 000F 0010 000F 0010 000F 0010 002F 0010 000F 0010 000F 0010 002F 0010 002F 0010 000F 0010 000F 0010 000F 0010 002F 0010 000F 0010 002F 0010 000F 0010 000F 0010 002F 0010 000F 0010 000F 0010 000F 0010 34AC
Raw Timing Data is another form of timing data often found. When using data you’ll need a frequency as well as the pulse times. If no frequency is available try 38000.
+3414 -1686 +433 -421 +433 -1294 +406 -440 +433 -421 +433 -413 +433 -421 +433 -440 +406 -440 +433 -421 +433
-413 +433 -421 +433 -413 +433 -421 +433 -1294 +433 -413 +433 -421 +433 -413 +433 -421 +433 -440 +406 –440 +433 -421 +433 -413 +433 -421 +433 -1294 +406 -440 +433 -421 +433 -413 +433 -421 +433 -413 +433 -421 +433
-440 +406 -440 +433 -421 +433 -413 +433 -421 +433 -440 +406 -1294 +433 -421 +433 -413 +433 -421 +433 -413 +433 -421 +433 -440 +406 -440 +433 -1267 +433 -421 +433 -440 +406 -1294 +433 -73694
10
UEI Learns
The learns from a JP1 remote can be imported too. From IR or RMIR, edit the learned key and then copy the data portion of the learned command, and then paste it into the Import window in IRScope.
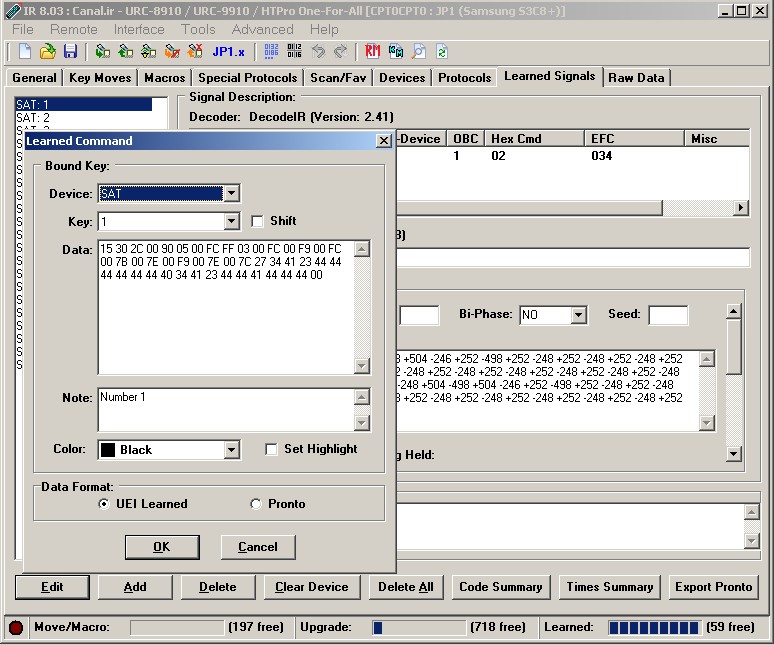
Figure 9, Learned signal from IR
JP1 people are pretty familiar with this screen. IR is the main JP1 program for downloading information from our remotes. Similar functionality is available in RMIR, the java based version of IR. IRScope can format and export UEI learns or Pronto learns. That exported data can be used to add learns to a JP1 remote.
EXPLORING THE MENUS
File Menu
| Capture | Capture is the same as the Capture button on screen
|
| Open | Open is same as the View button on screen |
| Import | Import is same as Import button on screen. |
| Summary | Creates as timing summary report, same as the summary button on screen |
| Save Last Signal | Saves the last signal captured with auto number naming. |
| Save Last Signal As | Saves the last signal captured but asks for a filename. |
| Save Selected As | Saves the information for the signals selected in the decode grid. |
| Save All as | Saves all the signals in the decode grid |
| Set Folder > Set Save Folder |
Use this option to set the folder where the ict files are to be saved. |
| Set Export Output Folder | This is the folder where exported files will be saved. If this option is grayed out, the Advanced menu’s Use Common Folder has been set and exported files will be written to the Save folder specified above. |
| Set IRP Folder | IRP files are only needed to export Pronto hex in the Export Proto like decode mode. You don’t need these files to export Pronto hex from timings. These IRP definitions can be downloaded from the JP1 file section. Use this option to locate the folder where the IRP definition files are stored. |
| Clear Recent
1 filename |
Clears the list of the last files accessed. |
| Exit | Quits the program and closes all waveform windows. |
. Edit menu
| Select All Ctrl+A | Selects all the signals from the decode grid. |
| Deselect All Ctrl+D | Deselect all the signals from the decode grid. |
| Clear All | Deletes all the signals from the decode grid. |
| Add Note to Selected Ctrl+N | This allows you to label each signal in the decode grid. This is an important feature when you are collecting a set of signals. These notes are used in the summary reports and in the export reports. |
| Move Selected Up Ctrl+Up | Moves the selected items in the decode grid up. |
| Move Selected Down Ctrl+Dn | Moves the selected items in the decode grid down. |
| Delete Selected Del | Deletes the selected items from the decode grid. |
Export Menu
| Export Last Signal | Creates or appends to a file with the name ExportedUEI, ExportedPronto or ExportedLintronic.txt depending on the current Export Mode. The file will be created in the file Export Output Folder or the Common Save Folder. Exports the last signal captured in the mode selected. |
| Export Selected Ctrl+E | Same as above, only this will export the signals selected in the decode grid. |
| Export Mode |
|
| UEI Learned | Use this option to create or append to a file named ExportedUEI.txt. The individual learns can be pasted into an ir file and uploaded into a learning remote. |
| Pronto from signal | Use this to create or append to a file named ExportedPronto.txt file based on the actual timings. |
| Pronto from decode | This file will create or append to a file named ExportedPronto.txt file based on the protocols rules. To use this option you need to download the IRP files required for MakeHex and set the IRP folder. Use this option to create proto hex suitable for presentations. |
| Lintronic | This file will appends to or creates an ExportedLincronic.txt file based on the actual timings. |
Advanced Menu
Help
| Interpreting IR Decodes | This option opens DecodeIR.HTM in your internet browser. DecodeIR, gives the information about the protocol rules used to decode the signals. |
| About | Displays the licensing and copyright information for IRScope. Note that on the software version numbers are not buried in the About box, they are already clearly displayed in the title bar of the main IRScope window. |
EXPLORING THE WAVEFORM
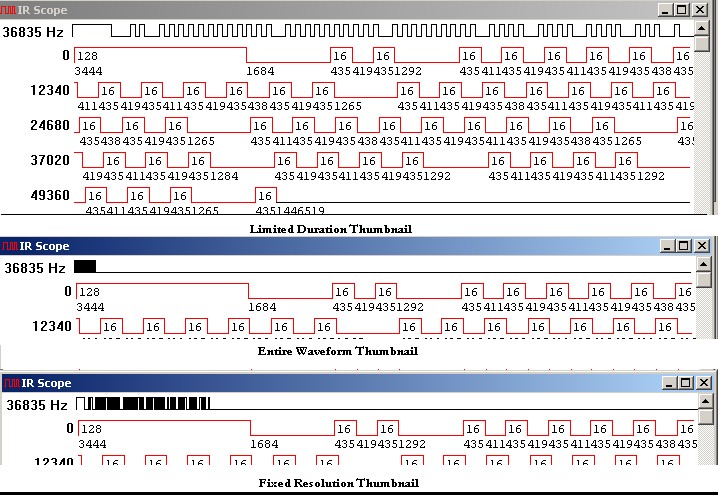
The waveform window is very useful in diagnosing problems and creating custom protocols. The waveform in Figure 10 has been labeled to show what the various parts of a waveform represent. The waveform can be seen on capture; when you Open or View an ict file; or when you double click on a signal from the decode grid. When double clicking the decode grid, the portion of the waveform that represents the selected decodes will be highlighted in red. The Frequency is in the upper corner. In Fig.10, the frequency is 39944hz. If a mixture of signals was captured, the frequency is not computed and instead < freq varies> is shown. Frequency is a measure of how many times the light flickered during an ON pulse time period. The pulse times are the numbers below the line. You may be used to seeing pulse times with + and minus like +2400, -600, + 1200 –600 +600 when no waveform is available. The – was used to indicate the quite times, not to indicate a negative time. Thumbnails The top line of the waveform windows shows thumbnails. There are three options to control how the thumbnail line will be displayed. Under the Advanced menu, Thumbnail Scale you have the option of Fixed Resolution, Limited Duration and Entire Waveform. Choose a thumbnail scale that suits your activity. Fixed Resolution When the thumbnail scale is set to fixed resolution, the thumbnail will always represent 500mS. Fixed resolution is your best choice when comparing signals in different waveform windows. Limited Duration When the thumbnail scale is set to limited duration, the thumbnail will be scaled to show the entire capture dropping any quiet time at the end of the signal. The thumbnail will shrink or expand depending on how long the infrared activity lasted.
Entire Waveform When the thumbnail scale is set to entire waveform, the thumbnail will represent the capture duration including any quite time at the end. Figure 11 shows the same capture showing in all three thumbnail scales. The capture duration was 1500ms, the infrared activity lasted only far less than the 500ms in the fixed.
Scalability. Another one of IRScope’s powerful features is the ability to change the resolution of the waveform. Not all signals will display well at the default 20 microseconds per pixel resolution. You can easily change this resolution to make the display more readable. You can also remove the pulse counts, pulse times and the elapsed time numbers from the display.
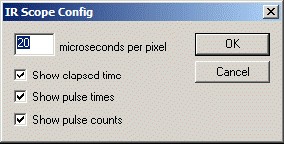
Figure 12. IRScope Config Dialog Box
Figure 12 shows the scale of the timing chart as presently displayed. The default resolution is 20 microseconds per pixel. The microseconds per pixel can be set anywhere from 1 to 2000. Click OK, and the display instantly shrinks or expands to the new scale.

Figure 13. Example of Waveforms Zoomed Out 5X
Figure 13 shows a simple example where the zooming feature has been used. The waveform displays of signals for buttons "1", "2", and "3" of an RCA remote have each been zoomed out to a resolution of 100 μS per pixel, then the windows were overlayed and lined up for comparison. Can you spot the subtle differences in timing between the three display patterns? Since all the carrier ON times are of uniform duration, and there are two sizes of OFF times, it's obvious this protocol encodes "1" and "0" bits by the amount of OFF time between carrier bursts. The "1 button" example in Figure 13 typifies the appearance you get when you just zoom out on a signal. The numbers showing ON and OFF times etc. are still there, but they overlap too much to be readable except for some of the larger ON and OFF times. The three check boxes in the IRScope Config dialog box enable you to turn off one or more of these measurements when you want to see a cleaner picture. To illustrate the effect, I unchecked all three boxes when zooming out on the "2 button" and "3 button" waveforms. Zooming in and out is fast, but if you prefer you can also open more than one copy of the same waveform and zoom them out to different scales for simultaneous viewing while studying a signal. When zooming, neither the size of the window nor the scale of the thumbnail display is changed. Only the scale of the waveform is expanded or contracted to show more or less detail. You can also stretch the overall width of a waveform display window to the full width of your screen, but that won't change the amount of detail shown. For an experiment, try stretching a display until the lines start at 0, 20000, 40000, 60000, etc. By doing this you have adjusted the display so that its width is exactly 20,000 μS, or 20 mS, a nice round number for estimating or measuring the position of various features.
IRScope's Output
IRScope has a lot of output formats. The formats are ICT files, Summary Reports, ExportedUEI.txt, ExportedPronto.txt, and ExportedLintronix.txt files. There are also two old legacy formats, audio.(wav) and TV-B-Gone (tvbg.c). ICT Infrared Capture Text IRScope's primary file format is the ICT file. ICT files are the only type of files used for both input and output in IRScope. ICT files can be created with the Save As, Save All As buttons and with the Save Last, Save Last As, Save Selected and Save Selected As items on the File Menu. The files will be stored in the folder specified in with the Set Output Save Folder option in the File Menu. Any option that included “As” will prompt for a filename. The other save methods will use automatic file naming form, (IRyyyymmddhhmmss.ict). ICT files can be opened with the View button from the screen, or with the Open command on the File menu. Saved files are in text format, and have an extension of .ict. Figure 14 shows the initial portion of a typical .ict file.
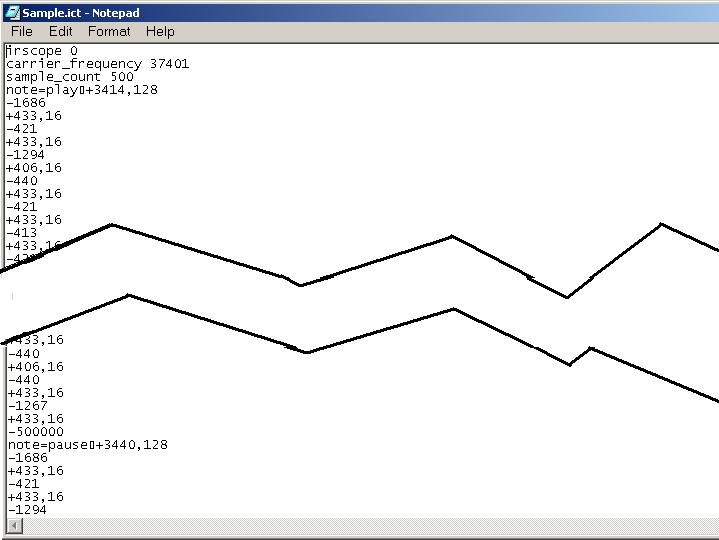
Figure 14. Portions of a Sample.ict File
In Figure 14, the numbers correspond to the timing numbers that appeared in the waveform. A number preceded by a "+" symbol is the ON time in microseconds for a carrier burst, and the number following a comma is the number of carrier cycles that make up that burst. A number proceeded by a "-" symbol is the OFF time in microseconds between carrier bursts. As you can see, there is enough data in the .ict file to completely reproduce a graphic display. Decode data is not part of a saved file. When a saved file is recalled, the decoder reprocesses the data to decode it. Any notes that were manually entered in the decode grid are also stored in the ict file. When the ict file is opened or viewed the note and decode will be added to the decode grid.
Summary file The summary file is an rtf (rich text format). This is an output only file. This report is created by pressing the Summary button on the screen, or selecting Summary from the File menu.
Exported files IRScope can also export timing data in UEI format, Pronto Format, and Lintronic Format. These files are for output only. Each format type has its own predefined filename ExportedUEI.txt, ExportedPronto.txt, and ExportedLintronics.txt. These files will be automatically located in the folder specified for Set Export Output Folder, or if the Common Output Folder option is set on the Advanced menu, these will be located in the Set Save Output Folder. If the filename already exists, the signals will be appended to the existing file. To export, select signals in the decode grid and press the Export button on the screen. The format to be exported is controlled by the Export Mode option on the Export menu.
Figures 16, 17 and 18 are examples of what the exported output looks like when viewed in notepad

Figure 17. Sample ExportedPronto.txt
The hex in the ExportedPronto files could have been created either from the raw timing data, or from the decode. The difference is that in Pronto from decode mode, the timings will be adjusted to match the IRP definition. The Pronto from Decode option makes hex that is free from itty-bitty capture variations, but you should verify that the signal truly complies with the decode, since this method could either correct or distort the signal. Hint: To make presentation worthy waveforms, export the pronto hex using the Pronto from Decode export mode. Then open the ExportedPronto.txt file in notepad. Copy the pronto hex for the signal from notepad and paste the data into IRScope’s Import window. This will make beautiful waveforms that use IRP timing data and don’t show any of the timing variations introduced during play and capture.
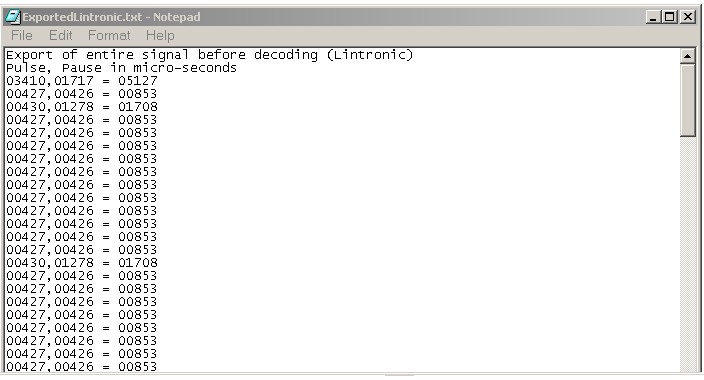
Figure 18. Partial ExportedLintronic.txt
Legacy Formats
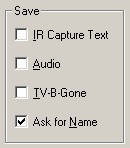
IRScope can produce two other output only formats, Audio (.wav) files and TV-B-Gone (tvbg.c) files. These formats were available in the original IRScope, but support for these formats has not evolved as the enhancements were made to IRScope. These legacy formats are only available in AutoSave mode on capture
TOMMY’S MACRO EXAMPLE
Solving problems with macros is much easier if you know exactly what is being transmitted and when. For an example I created a macro containing four commands on my URC6012 remote. I test fired it at the Widget to make sure I was getting multiple LED flashes, and based on that, I set the Capture Duration for 4000 mS. I also dropped down the Advanced menu and set the Thumbnail Scale to Entire Waveform.
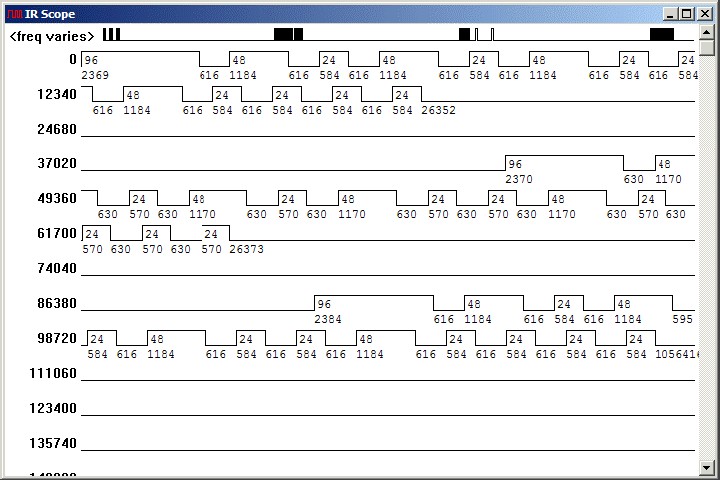
Figure 19. Example of Macro Waveform Display
Figure 19 shows the captured waveform display, and Figure 20 shows how IRScope has decoded the macro as four separate signals, as if you had pressed those four buttons individually. Each signal has a different carrier frequency, so the waveform display shows it as <freq varies>. The thumbnail shows the entire 4 seconds Capture Duration and, although you can't make out much detail, you can clearly see that it contains four signals. The main waveform display is only large enough to show the three frames of the first signal, which is only about 3% of the entire macro.
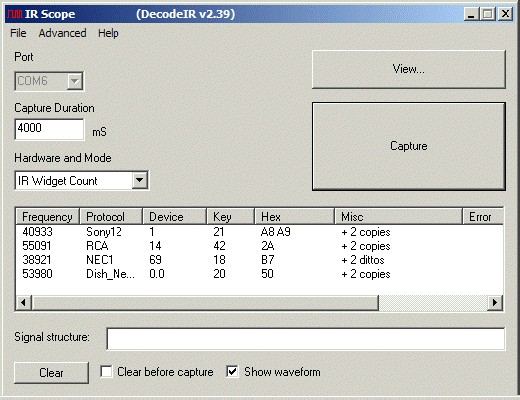
Figure 20. Example of Decoded Macro
There are several ways to get a better look at the overall picture: You can zoom out, you can scroll through it, you can use the waveform selection tool, or you can use a combination of these. Zooming out is a good way to see the time delays between macro commands. Figure 21 shows the macro zoomed out to 590 μS per pixel.
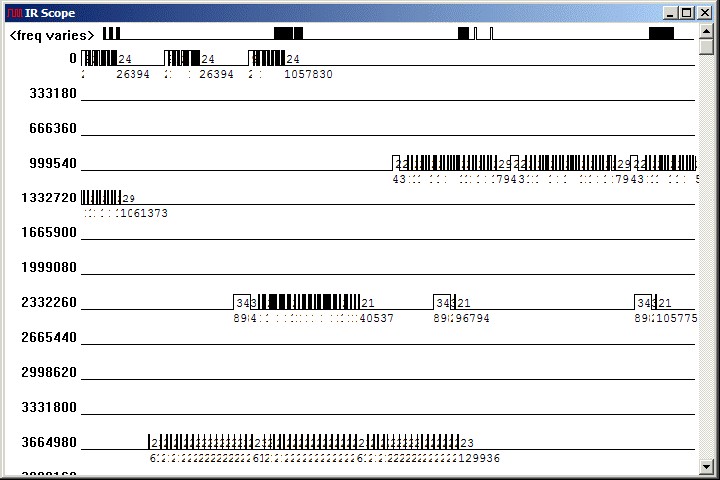
Figure 21. Example of Figure 19 After Zooming Out to 590 μS Per Pixel
Why did I select 590 μS per pixel? Note that in Figure 21 the last full line we can see starts at 135740 μS. So if we want to compress (zoom out on) the entire 4000 mS recording so it appears in that same space, we need to multiply the default resolution by 4000000 μS /135740 μS, or 29.5. So I double-clicked on the waveform display and changed the resolution from 20 microseconds per pixel to (29.5 x 20) = 590 microseconds per pixel. At this scale you can easily see the time delay between the four commands, shown as 1,057,830, 1,061,373, and 1,057,737 μS. (To be scientifically correct, you should express these and all other IRScope measurements to only three significant figures, such as 1.06 seconds, in consideration of the limit of their accuracy.) Other types of remotes might repeat the signals a different number of times, or separate the commands by more or less time, because macro specifications are not chiseled in stone. One reason people like to use Extenders is that they often reduce the delay between commands to speed up macro execution. If you are working with a large screen monitor and you really want to see this macro as one gigantic picture, here's the way to do it. After stretching the width and height of the window until it completely filled my screen, I noted that the bottom line started at 462000 μS. Dividing the overall macro Capture Duration, 4000000, by 462000 and multiplying by 20 μS per pixel gives 173 μS per pixel as my new resolution.
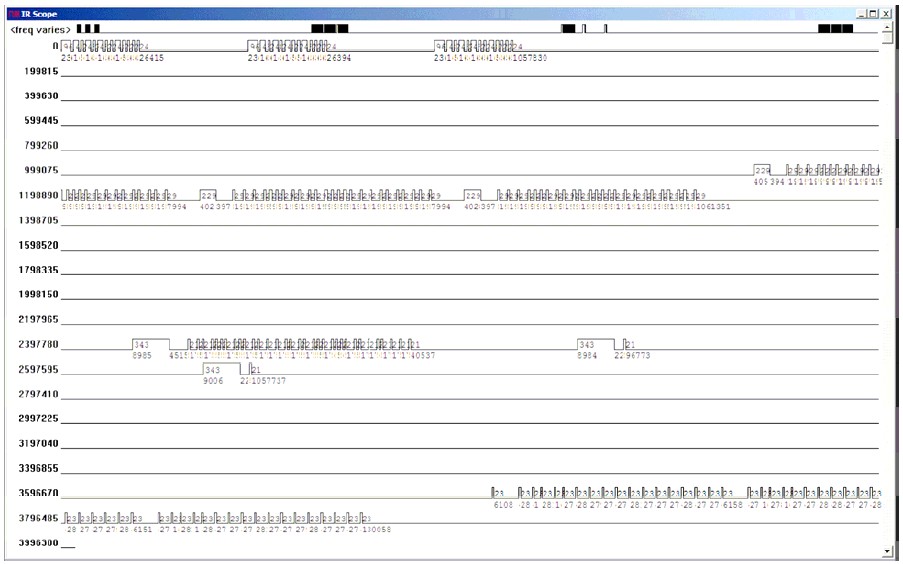
Figure 22. Macro of Figure 21 Expanded and Zoomed to Fill the Screen
Figure 22 shows the entire waveform display at this resolution, although the page is not really large enough to show it as well as it looks on a screen twice this size. Another easy way to examine a macro is with the waveform selection tool. Even though there is only one waveform display, selecting a signal for viewing is done the same way as with individual recordings. Just click on one of the four lines in the decode area and the macro waveform display will instantly scroll to that signal and highlight it in red. You will find that the measurement of carrier frequency and timing may not be quite as accurate when working with a macro. However, these errors are still well within the acceptable range of operation for the infrared receivers used in consumer devices. If you want more accurate measurements for one of the signals, capture a sample of that signal alone.
VICKY’S PROTOCOL EXAMPLE
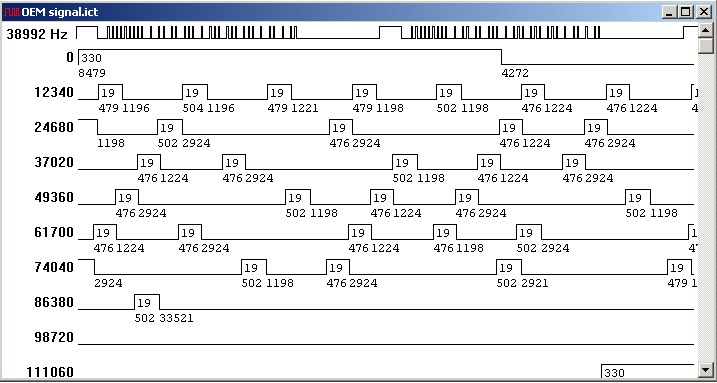
IRScope is a great companion for Protocol Builder (PB). PB is a Microsoft Excel spreadsheet that can create executors to handle oddball signals for our JP1 remotes. Getting the remote to produce the desired signal can be a challenge. IRScope’s waveform takes the guesswork out of the process since visual comparisons can ensure that the executor’s signal matches the OEM signal. IRScope is a great tool for debugging user upgrade problems too. Sometimes the user does everything right and the dang thing still won’t operate the equipment. Sometimes you actually need to see the signals to diagnose a problem. DecodeIR, IRScope’s decoding module, does some magical mathematical gymnastics to identify the various signals. Usually an unknown signal is identified as a Gap protocol or Unknown protocol. Occasionally the signal follows enough of the protocols rules to be misidentified. In my example, the OEM learns work, but the NEC2 upgrade, made from the decodes, did not work. All of the user’s files looked okay. I transferred the user’s learn to my remote, and captured the signal. I then loaded the upgrade into my remote, and captured the signal. On the surface everything looks good, but the user had reported that the signals don’t work.
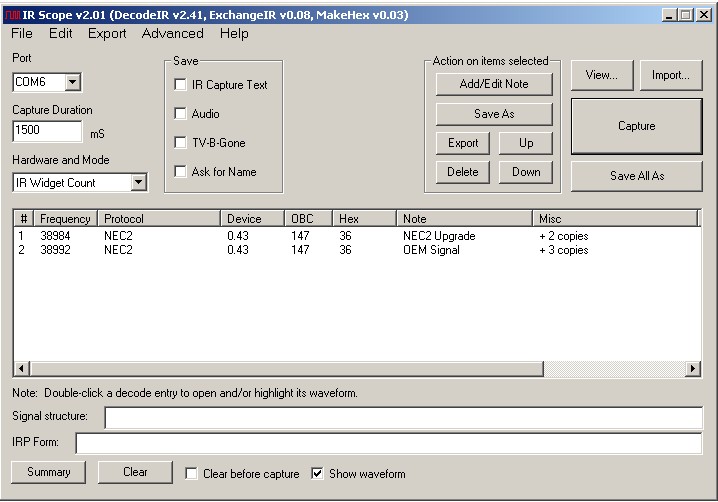
Figure 23: OEM Signal works, NEC2 Upgrade does not
Looking at the Decode Grid you see that the device, subdevice and OBC all match. You might notice the small difference in frequency, but that is insignificant. Most devices tolerate frequency differences of +1000 or -1000 or more without any issue, so the tiny frequency difference shown in fig.23, is not the cause of our problems. My first order of business is to make sure that I have my thumbnail scale to Fixed Resolution. This will set the thumbnail scale to be equal on all signals, regardless of the sample size. Both Limited Duration and Entire Waveform Thumbnails use arbitrary time lines and so thumbnails of different durations cause the thumbnails to be distorted so they can’t be easily compared.
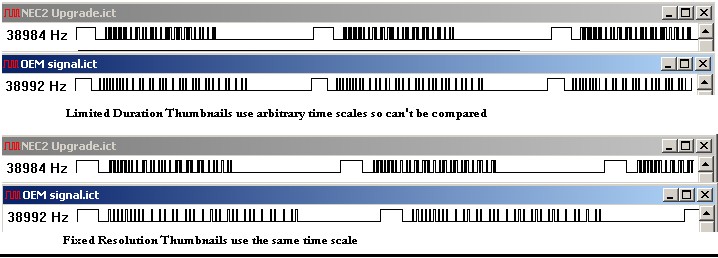
Figure 24. Limited Duration and Fixed Duration thumbnails.
In Figure 24, the Limited Duration makes the signals look more alike than they really are. The Fixed Resolution shows the signals on the same time scale. IRScope’s thumbnail comparisons can quickly point out problems. Certain signal problems have different characteristics. For instance, if the lead out time (the time between first frame and the second frame) is too long or too short, it can cause the repeat frames to be treated as new key presses, so a press of “1” might show up as “11”. In this user’s situation, the signals don’t didn’t work at all. When upgrade signals work, the thumbnails look like the thumbnails from the OEM signal. Remember, an IR signal is a timed light pattern, the timing is important. If you look at the Fixed Resolution thumbnails in fig. 24, you can easily see that the timings of the two samples are very different. Most equipment is pretty forgiving when it comes to small variations in pulse times, but no equipment is going to recognize signals that are this far off. We’re going to need a custom protocol here.
If the thumbnails had not made the problem so evident, I would have looked for more subtle timing problems by comparing the detail portion of the waveform. The OEM signal waveform, Figure 25, shows a typical variance in the pulse timings. We need to do some rounding here to get numbers we can work with. Generally timings with values within 50uS are considered to be equal.
When building a protocol executor in Protocol Builder (PB), I would use the rounded timings from the waveform to create an executor. I would use the following values to create the OEM signal shown in fig.25.
Lead-In Pair= + 8500, -4250
Zero = +500, -1250
One = +500, -3000
The official NEC2 IRP shows times in multiples of 564. Nec2 IRP notation: {38.4k,564}<1,-1|1,-3>(16,-8,D:8,S:8,F:8,~F:8,1,-78)+ Our IRP for the OEM signal, will be show times in a multiples of 500. If you are comfortable with IRP, you could do the computation and see how different these signals timings are.
|
Official Nec2 |
The OEM signal (fig.25) |
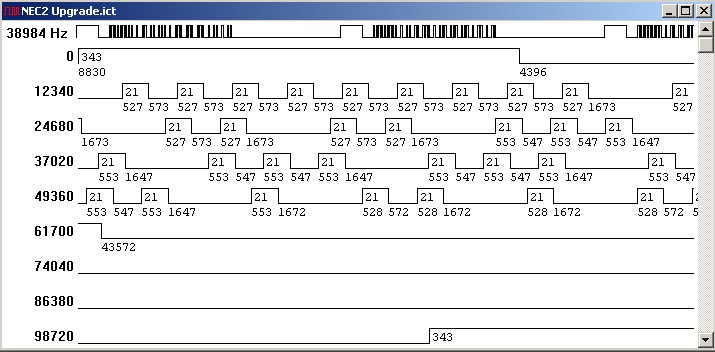
Figure 26, shows the pulse times when an upgrade is using the NEC2 executor.
For figure 26, I would round the timings to:
Lead in Pair =+8800, -4400
Zero =+550, -550
One= +550, -1650
Compared side by side, you can see that the NEC2 signal from the upgrade complies with the official
NEC2 IRP.
|
Official Nec2 times |
The Nec Upgrade signal fig(26) |

Figure 26. NEC2 Upgrade Signal
If you are not familiar with IRP, you could just compare the rounded timing values from both the OEM signal’s waveform in Figure 25, and the NEC2 upgrade signal in Figure 26. Compared side by side, you can see how much different the timings are.
|
The Nec2 Upgrade signals (fig.26) |
The OEM signal (fig.25) |
Apparently the OEM signal followed enough of the Nec2 protocol rules to fool decodeIR, but it is not nearly close enough to operate the equipment. The upgrade can’t use the NEC2 protocol. Instead a custom protocol executor would be written. An executor to send a signal like this, with such simple formatting rules, can be easily created by filling in the fields in a Protocol Builder spreadsheet. No additional assembly language programming would be necessary. After building the executor, I test the executor by shooting the signals at the Widget. Then I adjust settings as necessary to get the details as close to the OEM signals as possible. This assures that the equipment will respond reliably to upgrades created with the new executor. To learn more about IRP I recommend reading the Infrared Protocol Primer.
TROUBLESHOOTING
Why doesn’t my IRScope Window have a decode grid?
You may have disabled decodeIR. In the Advanced menu, uncheck Disable DecodeIR.
Why am I getting a file creation error when saving or exporting?
Make sure that the Set Save Folder and the Set Export Folder in the File menu have been set to valid directories and that you are not trying to store them directly in the root directory.
When trying to launch IRScope I get a message “Could not open File”.
IRScope only allows one session to run at a time. This message usually indicates IRScope is already running in another window. If that does not seem to be the case, confirm that by checking the
Applications Tab of the Windows Task Manger.
Why can’t I export Pronto Hex when in “Pronto from decode” mode?
The Pronto from decode mode only uses known protocols. If an unknown protocol is selected nothing will be exported, try the Pronto from timings mode instead.
I started IRScope, but I can’t find it.
Many settings are preserved between sessions using registry settings. Screen location is one of those settings. Use Windows Task Manager to switch to IRScope and then check the perimeters of the screen to see if you have moved IRScope to the edge and drag it back where you want it.
IRScope stores its registry settings in HKEY_CURRENT_USER/Software/UEIC/IRScope/Settings
COMMENTS AND SUGGESTIONS: Suggestions for additions or corrections to these instructions are welcomed and should be posted to the forum.
