AIRWidget and IRScope Operating Instructions
(→TAKING TIMING MEASUREMENTS FROM A WAVEFORM) |
(→THE MAIN WINDOW) |
||
| Line 29: | Line 29: | ||
The appearance may vary slightly depending on which Windows operating system you are using, as well as some of the configuration changes you may have made during your previous session. The registry has keys that preserve many configuration changes from one session to the next so you can save your preferences. To reset everything to default, run Regedit and delete the IRScope folder at HKEY_CURRENT_USER / Software / UEIC. | The appearance may vary slightly depending on which Windows operating system you are using, as well as some of the configuration changes you may have made during your previous session. The registry has keys that preserve many configuration changes from one session to the next so you can save your preferences. To reset everything to default, run Regedit and delete the IRScope folder at HKEY_CURRENT_USER / Software / UEIC. | ||
| − | <u>'''Port'''</u> .... This must be set to the virtual COM port your '''AIRWidget''' is connected to. There are two ways to set it, manual and automatic. If you drop down the Advanced tab menu and check the AutoLocate Widget option, then each time you open IRScope the computer will search through all the ports to find the '''AIRWidget''', and automatically select that port. It indicates this by greying out the Port box, as shown in Figure 2, and you can't change it. If you un-check the AutoLocate Widget option, then each time you open IRScope the Port box will be highlighted, letting you know that the port number shown may or may not be correct. If you get a port error message when you try to make a capture, drop down the list of COM ports and manually select the one that Device Manager says you are connected to. | + | :<u>'''Port'''</u> .... This must be set to the virtual COM port your '''AIRWidget''' is connected to. There are two ways to set it, manual and automatic. If you drop down the Advanced tab menu and check the AutoLocate Widget option, then each time you open IRScope the computer will search through all the ports to find the '''AIRWidget''', and automatically select that port. It indicates this by greying out the Port box, as shown in Figure 2, and you can't change it. If you un-check the AutoLocate Widget option, then each time you open IRScope the Port box will be highlighted, letting you know that the port number shown may or may not be correct. If you get a port error message when you try to make a capture, drop down the list of COM ports and manually select the one that Device Manager says you are connected to. |
| − | <u>'''Capture Duration'''</u> .... Shows the total length of a recording in milliseconds, starting when the '''AIRWidget''' detects the beginning of a signal from your remote. The entry in this box must be a number between 500 and 15000 (1/2 second to 15 seconds). The default value of 700 milliseconds is fine for capturing typical individual buttons, but should be increased to capture a macro containing several commands. | + | :<u>'''Capture Duration'''</u> .... Shows the total length of a recording in milliseconds, starting when the '''AIRWidget''' detects the beginning of a signal from your remote. The entry in this box must be a number between 500 and 15000 (1/2 second to 15 seconds). The default value of 700 milliseconds is fine for capturing typical individual buttons, but should be increased to capture a macro containing several commands. |
| − | <u>'''Hardware and Mode'''</u> .... <span style="color:red">'''When using the AIRWidget this must be set on Arduino Widget'''.</span> | + | :<u>'''Hardware and Mode'''</u> .... <span style="color:red">'''When using the AIRWidget this must be set on Arduino Widget'''.</span> |
| − | <u>'''View button'''</u> .... Used to select a previously saved file for viewing. | + | :<u>'''View button'''</u> .... Used to select a previously saved file for viewing. |
| − | <u>'''Import button'''</u> .... Used to import Pronto and UEI Learned formats and also Timing Lists of the form displayed by the Times Summary of the Learned Signals tab of IR.exe or by the new Summary facility of this program. The Pronto import can handle both raw and pre-defined Pronto formats other than format 8000. Imported signals are displayed exactly as if they had been captured with the '''AIRWidget'''. | + | :<u>'''Import button'''</u> .... Used to import Pronto and UEI Learned formats and also Timing Lists of the form displayed by the Times Summary of the Learned Signals tab of IR.exe or by the new Summary facility of this program. The Pronto import can handle both raw and pre-defined Pronto formats other than format 8000. Imported signals are displayed exactly as if they had been captured with the '''AIRWidget'''. |
| − | <u>'''Capture button'''</u> .... Prepares the system to collect data. When you are all set-up and ready to record a signal, place your remote so that its LED emitter is within a few inches of the sensor end of the '''AIRWidget'''. Click on Capture, then press a remote button to transmit a signal. If you wait longer than five seconds before pressing a remote button, the capture will time-out with an error message. Otherwise, captured data will appear at the end of the Capture Duration. The default configuration is for the program to output an audible beep when you click on Capture, and again if it times out in five seconds. If you don't like the beeps, click on Advanced and check the Suppress Beeps option. A flashing white indicator on the '''AIRWidget''' tells you when it detects infrared signals. If the indicator is on constantly, you may be in an area of too high ambient illumination. Avoid bright lights or direct sunlight where you use the '''AIRWidget'''. | + | :<u>'''Capture button'''</u> .... Prepares the system to collect data. When you are all set-up and ready to record a signal, place your remote so that its LED emitter is within a few inches of the sensor end of the '''AIRWidget'''. Click on Capture, then press a remote button to transmit a signal. If you wait longer than five seconds before pressing a remote button, the capture will time-out with an error message. Otherwise, captured data will appear at the end of the Capture Duration. The default configuration is for the program to output an audible beep when you click on Capture, and again if it times out in five seconds. If you don't like the beeps, click on Advanced and check the Suppress Beeps option. A flashing white indicator on the '''AIRWidget''' tells you when it detects infrared signals. If the indicator is on constantly, you may be in an area of too high ambient illumination. Avoid bright lights or direct sunlight where you use the '''AIRWidget'''. |
| − | <u>'''Decode area'''</u> .... This area shows a list of all the signals you have captured. Most of the column headings are self-explanatory, and the column widths are completely adjustable. If there is a sub-device, its number appears following a decimal point in the Device column. Comments in the Misc column describe repetition characteristics of a signal. No Repeat means the signal consisted of only one full frame. +N copies means the signal consisted of the initial frame followed by N identical copies. +N dittos means the signal consisted of the initial frame followed by N ditto frames. These terms are defined as follows: | + | :<u>'''Decode area'''</u> .... This area shows a list of all the signals you have captured. Most of the column headings are self-explanatory, and the column widths are completely adjustable. If there is a sub-device, its number appears following a decimal point in the Device column. Comments in the Misc column describe repetition characteristics of a signal. No Repeat means the signal consisted of only one full frame. +N copies means the signal consisted of the initial frame followed by N identical copies. +N dittos means the signal consisted of the initial frame followed by N ditto frames. These terms are defined as follows: |
| − | :A "signal" is a message or command that causes a device to do something. A macro is a collection of two or more signals to the same or different devices. | + | ::A "signal" is a message or command that causes a device to do something. A macro is a collection of two or more signals to the same or different devices. |
| − | :Signals are made up of one or more "frames". Sometimes frames are repeated as long as a button is held down. Many remotes are programmed to repeat frames two or three times for redundancy, even if a button is barely tapped. | + | ::Signals are made up of one or more "frames". Sometimes frames are repeated as long as a button is held down. Many remotes are programmed to repeat frames two or three times for redundancy, even if a button is barely tapped. |
| − | :Full frames often have an initial starting burst (usually distinctively long) and a final OFF time long enough to clearly indicate separation between frames. Within the frame are a series of bursts and spaces that encode address bits, data bits, etc. | + | ::Full frames often have an initial starting burst (usually distinctively long) and a final OFF time long enough to clearly indicate separation between frames. Within the frame are a series of bursts and spaces that encode address bits, data bits, etc. |
| − | :Ditto frames consist of only a starting and ending burst. They are used primarily to indicate that a button is being held down, such as might be done when increasing or decreasing audio volume. | + | ::Ditto frames consist of only a starting and ending burst. They are used primarily to indicate that a button is being held down, such as might be done when increasing or decreasing audio volume. |
| − | For saving, exporting, or deleting a recording, moving it up or down in the list, adding notes, etc., select (highlight) the target decode entry by single-clicking anywhere on it. Deselect that one by selecting another one. Or deselect all of them by clicking in a blank area. | + | :For saving, exporting, or deleting a recording, moving it up or down in the list, adding notes, etc., select (highlight) the target decode entry by single-clicking anywhere on it. Deselect that one by selecting another one. Or deselect all of them by clicking in a blank area. |
| − | <u>'''Start, End, and Error'''</u> This data is used mainly by Forum experts when debugging decoding problems, and so is not of much use to the typical user. You might prefer to make better use of screen space and keep the display simple by sliding those three columns beyond the right edge of the main window, out of sight. Some of the illustrations in these instructions may appear that way. | + | :<u>'''Start, End, and Error'''</u> This data is used mainly by Forum experts when debugging decoding problems, and so is not of much use to the typical user. You might prefer to make better use of screen space and keep the display simple by sliding those three columns beyond the right edge of the main window, out of sight. Some of the illustrations in these instructions may appear that way. |
| − | <u>'''Add/Edit Note'''</u> .... Used to open a Decode Note Editor box for adding or modifying a comment in the Note column for a signal you have selected (highlighted) in the decode panel. Very handy for keeping track of signal source identity, such as brand and model of device controlled, remote used, button pressed, etc. | + | :<u>'''Add/Edit Note'''</u> .... Used to open a Decode Note Editor box for adding or modifying a comment in the Note column for a signal you have selected (highlighted) in the decode panel. Very handy for keeping track of signal source identity, such as brand and model of device controlled, remote used, button pressed, etc. |
| − | <u>'''Save As'''</u> .... Used to save a recording you have selected (highlighted) in the decode area. If you select more than one recording they will be saved as a single file but with each signal clearly separated. | + | :<u>'''Save As'''</u> .... Used to save a recording you have selected (highlighted) in the decode area. If you select more than one recording they will be saved as a single file but with each signal clearly separated. |
| − | <u>'''Save All As'''</u> .... A faster and easier way to save the entire list of recordings in the decode area as a single file without having to first select them all individually. | + | :<u>'''Save All As'''</u> .... A faster and easier way to save the entire list of recordings in the decode area as a single file without having to first select them all individually. |
| − | <u>'''Export'''</u> .... Used to export decoded signals. The format depends on the selection in Export Mode under the Export drop-down menu, and can be either Pronto, UEI Learned, or Lintronic (a format used by the Beoworld community). The Pronto export is in the raw Pronto format, but can be generated from either the signal data or from its decode, as required. Exports are appended to a file called ExportedUEI.txt, ExportedPronto.txt or ExportedLintronic.txt, as appropriate, and the file is created if it does not exist. By default these files are created in the folder containing IRScope.exe but this can be changed with the Set Export Output Folder selection in the File drop-down menu. | + | :<u>'''Export'''</u> .... Used to export decoded signals. The format depends on the selection in Export Mode under the Export drop-down menu, and can be either Pronto, UEI Learned, or Lintronic (a format used by the Beoworld community). The Pronto export is in the raw Pronto format, but can be generated from either the signal data or from its decode, as required. Exports are appended to a file called ExportedUEI.txt, ExportedPronto.txt or ExportedLintronic.txt, as appropriate, and the file is created if it does not exist. By default these files are created in the folder containing IRScope.exe but this can be changed with the Set Export Output Folder selection in the File drop-down menu. |
| − | <u>'''Up, Down, and Delete'''</u> .... Used to change the order of items in the decode area, or delete them entirely. Deleting a decode entry automatically deletes its waveform display. | + | :<u>'''Up, Down, and Delete'''</u> .... Used to change the order of items in the decode area, or delete them entirely. Deleting a decode entry automatically deletes its waveform display. |
| − | <u>'''Signal structure'''</u> .... Shows additional information about a signal that is selected in the decode area. | + | :<u>'''Signal structure'''</u> .... Shows additional information about a signal that is selected in the decode area. |
| − | <u>'''IRP Form'''</u> .... Presents a signal in IRP form when it is selected in the Decode Panel. The IRP representation is made independently of the decode operation, so an IRP form can sometimes be determined for signals that cannot be decoded by DecodeIR, and vice versa. | + | :<u>'''IRP Form'''</u> .... Presents a signal in IRP form when it is selected in the Decode Panel. The IRP representation is made independently of the decode operation, so an IRP form can sometimes be determined for signals that cannot be decoded by DecodeIR, and vice versa. |
| − | <u>'''Summary'''</u> .... Opens a Summary display box like the one shown in Figure 3. | + | :<u>'''Summary'''</u> .... Opens a Summary display box like the one shown in Figure 3. |
[[File:AWFig3.jpg|frame|50px|center|Figure 3. Summary Display]] | [[File:AWFig3.jpg|frame|50px|center|Figure 3. Summary Display]] | ||
| − | In addition to decoded parameters, the Summary display includes two forms of timing for a signal, the raw timings as used in the waveform display, and analyzed timings in which repeats have been identified and timings averaged over supposedly identical bursts. To see all timing data, either scroll horizontally with the slider at the bottom, or check the Wrap to window box and scroll vertically with the slider at the right edge. The Summary display can be saved in either Rich Text Format (.rtf) or as a plain text file (.txt). | + | :In addition to decoded parameters, the Summary display includes two forms of timing for a signal, the raw timings as used in the waveform display, and analyzed timings in which repeats have been identified and timings averaged over supposedly identical bursts. To see all timing data, either scroll horizontally with the slider at the bottom, or check the Wrap to window box and scroll vertically with the slider at the right edge. The Summary display can be saved in either Rich Text Format (.rtf) or as a plain text file (.txt). |
| − | Clear .... Clears all entries in the decode area and their corresponding waveform displays. Does not delete any previously saved files. | + | :<u>'''Clear'''</u> .... Clears all entries in the decode area and their corresponding waveform displays. Does not delete any previously saved files. |
| − | Clear before capture .... Check this box to automatically clear the previous decode data and waveform each time you click on the Capture button to make a new recording. | + | :<u>'''Clear before capture'''</u> .... Check this box to automatically clear the previous decode data and waveform each time you click on the Capture button to make a new recording. |
| − | Show waveform .... Checked by default, provides a Waveform Display of each new captured signal. | + | :<u>'''Show waveform'''</u> .... Checked by default, provides a Waveform Display of each new captured signal. |
| − | Menu Bar Right below the title bar of the main window is a menu bar with five drop-down menus, File, Edit, Export, Advanced, and Help. There are so many sophisticated features within these menus that rather than try to explain them all here I suggest you experiment with them to explore your needs and preferences. | + | :<u>'''Menu Bar'''</u> Right below the title bar of the main window is a menu bar with five drop-down menus, File, Edit, Export, Advanced, and Help. There are so many sophisticated features within these menus that rather than try to explain them all here I suggest you experiment with them to explore your needs and preferences. |
=THE WAVEFORM DISPLAY= | =THE WAVEFORM DISPLAY= | ||
Revision as of 21:01, 7 March 2023
INTRODUCTION
These instructions apply to the Arduino IR Widget (AIRWidget) when used with its companion Windows software, IRScope v3.05. Performance is functionally identical to that of the old IR Widget when used with IRScope 2.01a, and remains unsurpassed as a tool for capturing, recording, and analyzing signals transmitted by infrared remote controls. Its fast optical sensor detects individual pulses of a remote's infrared LED to measure carrier frequency and ON/OFF times of carrier bursts with much greater accuracy and detail than possible with any other type of measurement instrument. IRScope uses its smart algorithms and broad data base to identify the signal protocol and provide a complete analysis. A graphic display similar to that of a digital storage oscilloscope provides a visual representation of the signal and shows precise timing details. Each recording can be from 1/2 to 15 seconds long, and can be zoomed in or out to an exact scale from 1 to 1000 microseconds per pixel on your PC screen. The AIRWidget can display an unlimited number of records simultaneously, and data can be saved or imported and exported in many different formats. Section 13 on page 15 of these instructions shows how to build the simple, inexpensive AIRWidget shown above and tells how to obtain the free software sketch the Arduino Nano needs to run it.
APPLICATION SOFTWARE
A software bundle for IRScope (IRScope v3.05) can be downloaded at IRScope , from which you can extract these files:
- DecodeIR.dll ............................. Application extension
- DecodeIR.html .......................... Chrome HTML Document
- ExchangeIR.dll ......................... Application extension
- IRScope.exe ............................ Application
- MakeHex.dll ............................. Application extension
- ReadMe.txt .............................. Text Document
Installing the software consists simply of placing items (1) through (4) in the same folder (any folder of your choice). Items (5) and (6) are not essential to operation of the AIRWidget and can be discarded if you don't want to keep them. Item (5) is a good summary of the major features of IRScope, and also provides some useful information on drivers for the AIRWidget and how to install them. Item (6) is an excellent reference on how protocols are decoded, and provides specifications for more than 100 of the most common infrared remote control protocols.
USB DRIVER
AIRWidget requires the latest virtual COM port (VCP) driver available from FTDI Chip Ltd. Windows 7 may search and find the driver automatically, but if that doesn't work you can download it at: FTDI Drivers. If by chance you have an old version FTDI driver installed in your PC (older than 2.04.06) you must first uninstall it by using a utility called CDM Uninstaller 1.4, which you can download at: CDM Uninstaller as either a command line version or GUI version. The uninstaller download includes a brief readme.html file that explains how to use it.
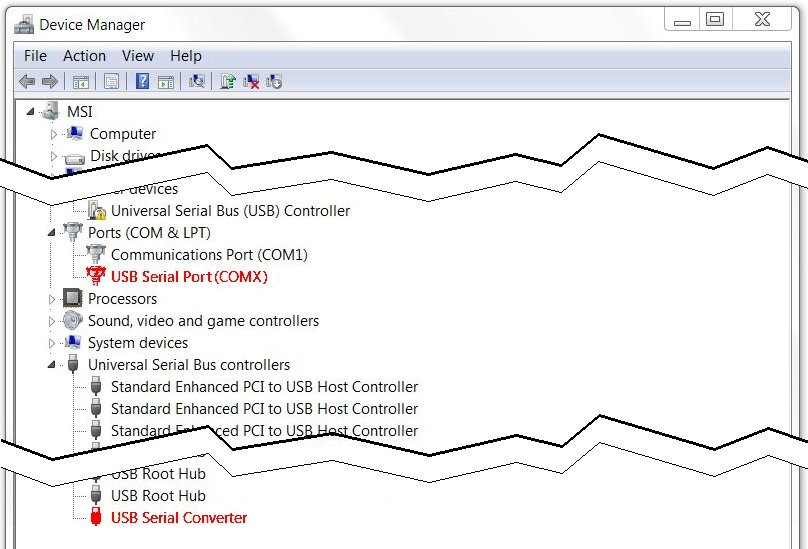
The first time you plug in your AIRWidget, Windows' New Hardware Wizard will prompt you through the driver installation process in two phases. First, a driver ls installed for the USB Serial Converter function of AIRWidget. Following that, a driver is installed for the USB Serial Port function of the AIRWidget. Windows may do it all automatically. In case of problems you can verify whether your driver installation is working by opening Device Manager and expanding both the Ports (COM & LPT) list and the Universal Serial Bus controllers list. Watch the lists as you plug in the AIRWidget. A new entry called USB Serial Port (COMX) (where "X" is the virtual COM port number assigned by Windows) should pop up at the end of the Ports (COM & LPT) list. Simultaneously, a new entry called USB Serial Converter should pop up at the end of the Universal Serial Bus controllers list, as shown below in Figure 1.
THE MAIN WINDOW
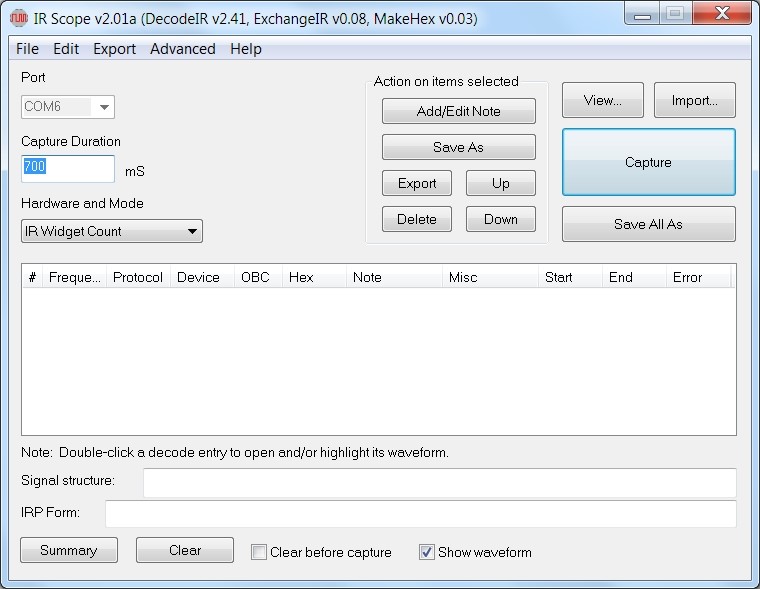
After plugging in your AIRWidget and opening IRScope the operating window will look something like Figure 2 below. It contains all of the AIRWidget controls, and will remain on your screen as long as your recording session is active. The large blank area in the center is the decode area. It will list all the signals you capture, and also those you retrieve from previously saved records.
The appearance may vary slightly depending on which Windows operating system you are using, as well as some of the configuration changes you may have made during your previous session. The registry has keys that preserve many configuration changes from one session to the next so you can save your preferences. To reset everything to default, run Regedit and delete the IRScope folder at HKEY_CURRENT_USER / Software / UEIC.
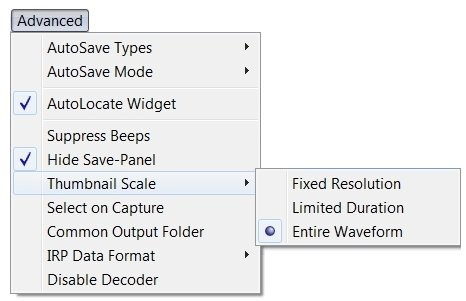
- Port .... This must be set to the virtual COM port your AIRWidget is connected to. There are two ways to set it, manual and automatic. If you drop down the Advanced tab menu and check the AutoLocate Widget option, then each time you open IRScope the computer will search through all the ports to find the AIRWidget, and automatically select that port. It indicates this by greying out the Port box, as shown in Figure 2, and you can't change it. If you un-check the AutoLocate Widget option, then each time you open IRScope the Port box will be highlighted, letting you know that the port number shown may or may not be correct. If you get a port error message when you try to make a capture, drop down the list of COM ports and manually select the one that Device Manager says you are connected to.
- Capture Duration .... Shows the total length of a recording in milliseconds, starting when the AIRWidget detects the beginning of a signal from your remote. The entry in this box must be a number between 500 and 15000 (1/2 second to 15 seconds). The default value of 700 milliseconds is fine for capturing typical individual buttons, but should be increased to capture a macro containing several commands.
- Hardware and Mode .... When using the AIRWidget this must be set on Arduino Widget.
- View button .... Used to select a previously saved file for viewing.
- Import button .... Used to import Pronto and UEI Learned formats and also Timing Lists of the form displayed by the Times Summary of the Learned Signals tab of IR.exe or by the new Summary facility of this program. The Pronto import can handle both raw and pre-defined Pronto formats other than format 8000. Imported signals are displayed exactly as if they had been captured with the AIRWidget.
- Capture button .... Prepares the system to collect data. When you are all set-up and ready to record a signal, place your remote so that its LED emitter is within a few inches of the sensor end of the AIRWidget. Click on Capture, then press a remote button to transmit a signal. If you wait longer than five seconds before pressing a remote button, the capture will time-out with an error message. Otherwise, captured data will appear at the end of the Capture Duration. The default configuration is for the program to output an audible beep when you click on Capture, and again if it times out in five seconds. If you don't like the beeps, click on Advanced and check the Suppress Beeps option. A flashing white indicator on the AIRWidget tells you when it detects infrared signals. If the indicator is on constantly, you may be in an area of too high ambient illumination. Avoid bright lights or direct sunlight where you use the AIRWidget.
- Decode area .... This area shows a list of all the signals you have captured. Most of the column headings are self-explanatory, and the column widths are completely adjustable. If there is a sub-device, its number appears following a decimal point in the Device column. Comments in the Misc column describe repetition characteristics of a signal. No Repeat means the signal consisted of only one full frame. +N copies means the signal consisted of the initial frame followed by N identical copies. +N dittos means the signal consisted of the initial frame followed by N ditto frames. These terms are defined as follows:
- A "signal" is a message or command that causes a device to do something. A macro is a collection of two or more signals to the same or different devices.
- Signals are made up of one or more "frames". Sometimes frames are repeated as long as a button is held down. Many remotes are programmed to repeat frames two or three times for redundancy, even if a button is barely tapped.
- Full frames often have an initial starting burst (usually distinctively long) and a final OFF time long enough to clearly indicate separation between frames. Within the frame are a series of bursts and spaces that encode address bits, data bits, etc.
- Ditto frames consist of only a starting and ending burst. They are used primarily to indicate that a button is being held down, such as might be done when increasing or decreasing audio volume.
- For saving, exporting, or deleting a recording, moving it up or down in the list, adding notes, etc., select (highlight) the target decode entry by single-clicking anywhere on it. Deselect that one by selecting another one. Or deselect all of them by clicking in a blank area.
- Start, End, and Error This data is used mainly by Forum experts when debugging decoding problems, and so is not of much use to the typical user. You might prefer to make better use of screen space and keep the display simple by sliding those three columns beyond the right edge of the main window, out of sight. Some of the illustrations in these instructions may appear that way.
- Add/Edit Note .... Used to open a Decode Note Editor box for adding or modifying a comment in the Note column for a signal you have selected (highlighted) in the decode panel. Very handy for keeping track of signal source identity, such as brand and model of device controlled, remote used, button pressed, etc.
- Save As .... Used to save a recording you have selected (highlighted) in the decode area. If you select more than one recording they will be saved as a single file but with each signal clearly separated.
- Save All As .... A faster and easier way to save the entire list of recordings in the decode area as a single file without having to first select them all individually.
- Export .... Used to export decoded signals. The format depends on the selection in Export Mode under the Export drop-down menu, and can be either Pronto, UEI Learned, or Lintronic (a format used by the Beoworld community). The Pronto export is in the raw Pronto format, but can be generated from either the signal data or from its decode, as required. Exports are appended to a file called ExportedUEI.txt, ExportedPronto.txt or ExportedLintronic.txt, as appropriate, and the file is created if it does not exist. By default these files are created in the folder containing IRScope.exe but this can be changed with the Set Export Output Folder selection in the File drop-down menu.
- Up, Down, and Delete .... Used to change the order of items in the decode area, or delete them entirely. Deleting a decode entry automatically deletes its waveform display.
- Signal structure .... Shows additional information about a signal that is selected in the decode area.
- IRP Form .... Presents a signal in IRP form when it is selected in the Decode Panel. The IRP representation is made independently of the decode operation, so an IRP form can sometimes be determined for signals that cannot be decoded by DecodeIR, and vice versa.
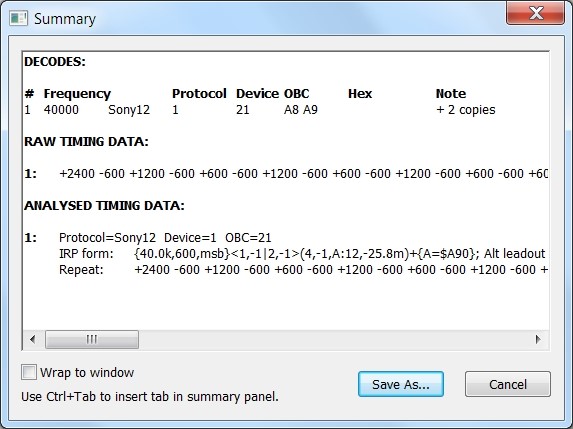
- Summary .... Opens a Summary display box like the one shown in Figure 3.
- In addition to decoded parameters, the Summary display includes two forms of timing for a signal, the raw timings as used in the waveform display, and analyzed timings in which repeats have been identified and timings averaged over supposedly identical bursts. To see all timing data, either scroll horizontally with the slider at the bottom, or check the Wrap to window box and scroll vertically with the slider at the right edge. The Summary display can be saved in either Rich Text Format (.rtf) or as a plain text file (.txt).
- Clear .... Clears all entries in the decode area and their corresponding waveform displays. Does not delete any previously saved files.
- Clear before capture .... Check this box to automatically clear the previous decode data and waveform each time you click on the Capture button to make a new recording.
- Show waveform .... Checked by default, provides a Waveform Display of each new captured signal.
- Menu Bar Right below the title bar of the main window is a menu bar with five drop-down menus, File, Edit, Export, Advanced, and Help. There are so many sophisticated features within these menus that rather than try to explain them all here I suggest you experiment with them to explore your needs and preferences.
THE WAVEFORM DISPLAY
Displaying a detailed picture of a recorded signal is a key feature of IRScope. When you click on the Capture button, the PC sends a signal to the AIRWidget to start looking for an IR signal. When the AIRWidget detects a remote signal it starts transmitting data to the PC at precise intervals, telling it how many infrared carrier pulses it has seen and when the carrier is turned on and off. At the end of the selected Capture Duration time, the PC sends another signal to the AIRWidget to stop looking.
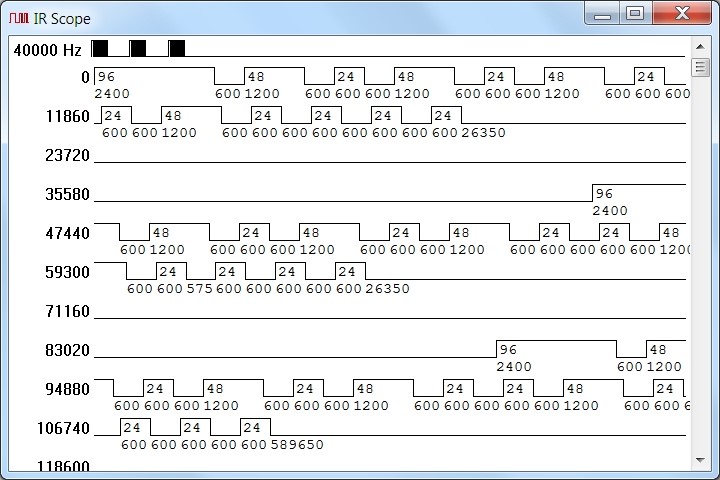
IRScope then processes the data and displays the results two ways. First, its analysis and identification of the recording appears in the decode area of the main window. Second, a waveform display pops up in the upper left corner of your screen. Those two items define what was captured, and remain linked together (even if you close the waveform display), until you delete the decode entry. For an example we will use a recording captured from a Sony remote by pointing it at the AIRWidget, clicking on Capture, the tapping the POWER button on the remote. Figure 4 shows the resulting waveform display, and Figure 5 shows the corresponding decode entry that appears in the main window. Even if IRScope is unable to identify a signal it has captured, it still displays the waveform it received from the AIRWidget and labels it "unknown" in the protocol column of the decode area.
In Figure 4, the first line of the waveform display shows the carrier frequency, followed by a one-line thumbnail sketch of the captured signal that provides an overview of your recording. Our example was shot with the default selection of Thumbnail Scale, which is Entire Waveform. That means the thumbnail shows everything that was recorded, from the beginning of the first signal to the end of the Capture Duration period.
To select a different format for the thumbnail display, drop down the Advanced tab of the main window. There are three choices available.
Fixed Resolution shows captured data at a resolution of 400µs per pixel:
Limited Duration shows as much of the captured data as will fit on the line, up to a maximum of 300ms:
Entire Waveform shows everything captured during the entire Capture Duration time:
The thumbnail scale is universal, and all waveform displays are immediately updated as soon as a new thumbnail scale format is selected. It's not necessary to capture new samples after changing it, and you can change it as often as you like to find the one that you prefer in various situations.
Sony12 protocol specifies that a remote should transmit a frame repeatedly about twenty times per second as long as a button is held down, but in no case less than three times even for a brief press of the button. In our example the button was just tapped lightly. But If it had been held down steadily, the Misc column of the decode entry would have said +14 copies, and the thumbnail would have looked like this:
The waveform display in Figure 4 depicts the demodulated carrier, drawn to a precise scale of 20µs per pixel. Waveform timing starts on the second line at time 0 (the moment the remote began transmitting), and increases from left to right across successive rows as you move down the screen. Numbers down the left side (11860, 23720, 35580, 47440, etc.) show the time in µs at that point in the waveform. Raised portions of the waveform are periods when the carrier is turned ON, and lower (baseline) portions are periods when it is turned OFF. Numbers beneath the baseline (2400, 600, 1200, 600, etc.) are carrier ON and OFF times in µs, and numbers above the baseline within the raised portions (96, 48, 24, 48, etc.) are the number of carrier cycles (infrared pulses) that were counted by the AIRWidget during those ON bursts.
Each time you capture a record a new waveform is displayed, always in the upper left area of the screen at default size, stacked on top of those previously recorded, and a new decode line is added in numerical order in the decode area of the window. If the recording is of a macro it will be shown as a single waveform display with the actual time of separation between commands. But each command of a macro will be listed separately in the main window with its own individual carrier frequency, protocol identity, and decoding, as if they were recorded separately.
You can drag waveforms anywhere on your screen to compare several of them at the same time, or you can use the convenient Waveform Selection Tool (described in Section 6) to look at them one at a time. The size, location, and scale of each waveform display can be individually adjusted with the mouse, but the changes will remain in effect only during the current session and cannot be permanently saved with the waveforms.
THE WAVEFORM SELECTION TOOL
This is without doubt one of the handiest features of IRScope. It enables you to list a large number of recordings in the decode area and have instant access to the waveform of any one of them with a click of the mouse. The "Note" below the main window is completely explanatory: "Double-click a decode entry to open and/or highlight its waveform."
Suppose you have collected six records, all listed in the decode area in the order you captured them, with waveforms stacked on top of each other on your screen so that all you can see is record #6 on top of the stack. If you wanted to examine, for example, record #3 you simply double-click on that decode entry in the main window and Instantly that waveform display is brought to the top of the stack and highlighted in red.
You don't even have to leave the waveforms stacked on your screen to use the selection tool. You can get them all out of the way by CLOSING them, as long as you DO NOT delete anything in the decode list of the main window. When you double-click an entry, the waveform will be re-opened automatically and highlighted for you.
The selection tool works similarly with macro waveforms. Instead of having to tediously scroll through a macro waveform display containing a bunch of commands to get to the one you want to examine, just double-click on its decode entry in the main window. If the macro waveform is already opened it will Instantly scroll to that command, without changing size or position, and highlight only that portion of the macro so there's no mistake where it starts and ends. If the macro waveform is closed, it will re-open automatically and scroll to the highlighted command.
SAVING AND RETRIEVING CAPTURED DATA
It is strongly suggested that you form the habit of naming and saving important files promptly. When collecting a lot of data it's easy to get carried away and lose track of which records are which. Every capture event, whether it be for an individual signal or a macro, produces a temporary file containing all of the numerical data sent from the AIRWidget and used to generate the signal analysis in the decode area as well as the graphic Waveform Display. This data can be saved under a filename of your own choosing, or under a default filename automatically generated by IRScope, and consisting of the letters IR followed by a 14-character date/time code in the format: [YYYY] [MM] [DD] [HH] [MM] [SS]. Example: IR20150411083927. NOTE: This is the date/time you are saving the file, not the date/time the recording was collected. If you save a file using the same name as on that is already saved, the new file will replace the old file without any warning.
Saved files have an extension of .ict, but they are in text format and you can look at them with any text editor.
Figure 6 shows the initial portion of a typical .ict file that has been opened with Notepad. A number preceded by a "+" symbol is a carrier burst ON time in microseconds, followed by a comma and another number which is the number of carrier cycles in that burst. A number preceded by a "─" symbol is an OFF time in microseconds between carrier bursts. As you can see, there's enough information in the .ict file to completely reproduce the recording.
Once you have saved a file, its filename appears in the title bar of the Waveform Display. You can tell that the file in Figure 5 has not yet been saved because the title bar is blank. Note that what you are saving consists mainly of raw numeric measurement data, not the decode analysis. When a saved file is reopened, DecodeIR makes a fresh analysis, and its decode data immediately appears in the decode area. If you open two or more copies of the same file, duplicate copies of the decode data will appear. Notes which have been added to a decode entry in the Note column can also be saved so they are reproduced whenever the file is recalled. The note, if saved, is placed at the beginning of the first line of burst data in the .ict file. But configuration changes made to a waveform display (e.g., zooming or resizing the waveform window) cannot be saved.
CHANGING THE APPEARANCE OF A WAVEFORM DISPLAY
IRScope allows you to manipulate the appearance of waveform displays in many ways, for taking measurements, making comparisons, etc. Probably the change that is most useful is to vary the waveform resolution to see more or less detail. It's fast and easy. To illustrate, I'll start with Figure 4 as an example. Here's the start of what that waveform looks like as captured.
First I'll drag the width of the waveform window so that it fills the full width of my screen.
You'll notice that the amount of time shown in each horizontal line increased from 11860µs to 23180µs, enough to show a complete frame on one line. But resolution remains unchanged from the default value of 20µs per pixel.
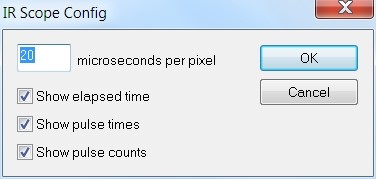
Clicking anywhere on a waveform display pops up the IRScope Config box showing the present resolution.
If we type any value from 1 to 1000 into the highlighted “microseconds per pixel” box and either hit Enter or click OK, the display instantly zooms to the new resolution. Here's what the waveform looks like after we enter a resolution value of 100 microseconds per pixel to show all three frames on one line. The window size and thumbnail resolution are not affected.
The numbers showing ON and OFF times and carrier pulse counts are still there, but they are too close together to be readable. Unchecking those boxes in IRScope Config turns off the numbers for a clearer view of the waveform.
Here's a portion of a capture from a Pioneer DVD remote at standard resolution. It shows how hard it is to distinguish all the time values when the protocol has many short on/off times in sequence.
Zooming in to a resolution of 15µs or more makes it much easier to read the on and off times.
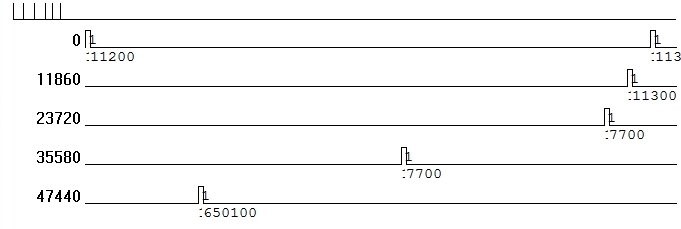
All examples shown so far are of PWM (pulse width modulation) protocols, where data bits (1's and 0's) are encoded either as the width of carrier-ON bursts separated by fixed duration OFF times, or the width of OFF times separated by fixed duration carrier-ON bursts. Most IR protocols are PWM, but a few are PPM (pulse position modulation) protocol. Here's an example of a Jerrold Cable PPM signal captured at standard resolution.
Since there is no carrier, no frequency value is shown at the beginning of the thumbnail, and a "0" is placed in the Frequency column of the decode entry. Let's zoom out to 120µs per pixel so things are not so spread out.
Now you can see clearly that one frame of the signal has six single pulses, separated by two different spaces, 11.3ms and 7.7ms. Let's zoom in as far as we can go (1µs per pixel) to look at a pulse in greater detail.
The waveform now shows each pulse has a width of exactly 100µs, but that's misleading. Since the Widget only reports the number of pulses it sees every 100µs and doesn't measure them, we can't tell what the actual pulse width is. We know only that it is a single pulse whose width is 100µs or less. (Examining these pulses with an oscilloscope would show them to be actually about 75µs wide.)
WORKING WITH MACROS
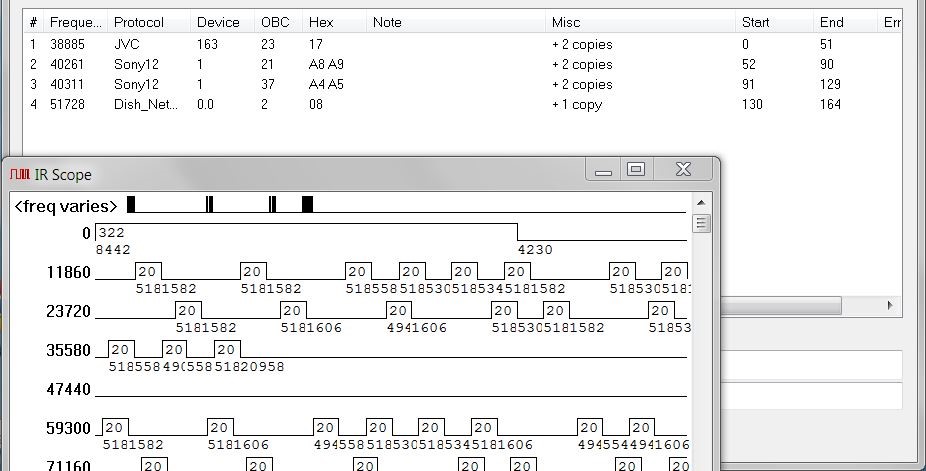
Capturing a macro is not much different from capturing an individual command. The main thing to remember is to set the Capture Duration to a value greater than the macro duration. Here's an example of a typical macro for which I made an initial test capture with a duration setting of 10,000 ms.
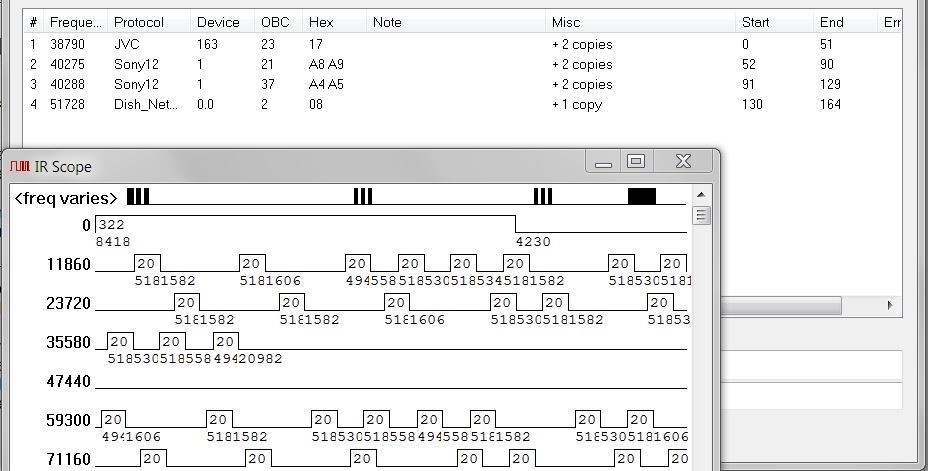
The decode panel shows that this macro sends four commands:
- Turn on a JVC receiver
- Turn on a Sony TV
- Send a TV/VCR command to the TV to set the input to VIDEO1
- Turn on a Dish Network satellite receiver
Note that each command of the macro is listed separately in the decode panel so that there is a place to show carrier frequency and decoding details. In the waveform display of the macro, the thumbnail shows all four commands and the precise timing between them, however irregular it may be. But since several different carrier frequencies are involved, the usual carrier frequency value is replaced with the comment "freq varies".
The first thing I'll do is to stretch the waveform display until that thumbnail line is an even ruler dimension on the PC screen, to give me a thumbnail scale factor of 10 seconds (the capture duration) divided by 10 inches (the length to which I adjusted the line), or 1 second/inch. Then I'll measure from start to the end of the fourth command. It is a little less than 3-1/4 inches. That means I can record the entire macro with a capture duration setting of just a little over 3-1/4 seconds. The data will be just as accurate, but I will avoid a lot of waiting for the capture to complete each time I have to re-record that same macro as I work with it.
Here's the same macro with capture duration reduced to 3500ms. Compare this thumbnail with that in Figure 7, and remember that our thumbnail scale is set to show the entire capture duration. When the captured signal is part of a macro, the calculation of carrier frequency shown in the decode entry is close, but not quite as accurate as when the signal is captured alone. So if you want the most accurate measurement of carrier frequency possible you'll have to capture a sample of that signal protocol alone, not as part of a macro. Macro speed (delay between commands) is usually determined by the design of the particular remote control used. Sometimes it is possible to speed-up macro execution, and the AIRWidget can be of great help in testing changes to make sure you are not trying to go so fast that the equipment doesn't have time to respond to successive commands.
Remember to use the Waveform Selection Tool to zip instantly to different commands of a macro recording for examination. Don't waste time scrolling. You can save one or several commands of a macro as one file by selecting them in the Decode Panel and using the Save As button. But to save the entire macro as one file you don't have to select them one at a time. Just use the Save All As button instead.
TAKING TIMING MEASUREMENTS FROM A WAVEFORM
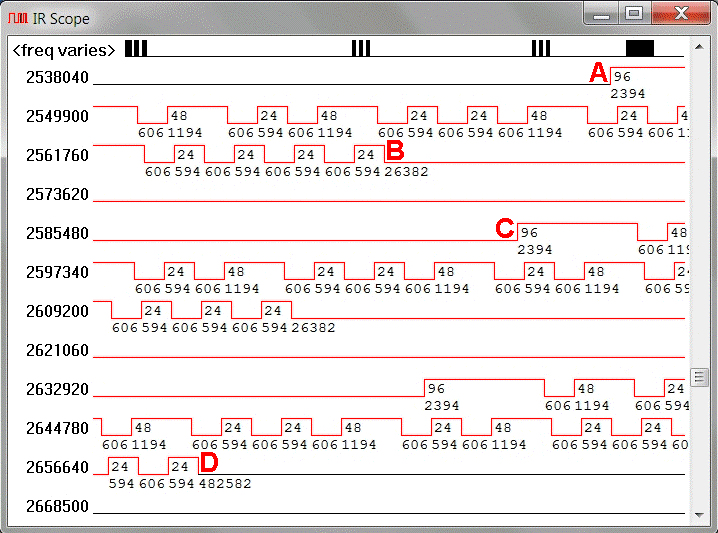
Since waveforms are drawn to exact scale and labeled with elapsed time at the start of each line as well as the duration of all carrier ON and OFF times, you can often just read the time you're interested in, or find it by adding a few values. As an example, suppose I wanted to find the time between the first and second frames of the third command of the macro of Figure 8. First I double-click on item 3 in the decode area so that the Waveform Selection Tool immediately displays command #3 highlighted in red, as shown in Figure 9. The time we are looking for is from B (the end of frame #1) to C (the beginning of frame #2).
That's the same as the OFF time of 26382µs shown right below the line at B. Too simple. Let's make the example more complicated. Suppose I wanted to find the total length of the third command, from A to D in Figure 9. I'll show you three ways to do that, and you can decide which you prefer.
- a. Summation Method This method is a no-brainer. Just add all the ON and OFF time values below the line from the first point of interest, A, to the second point of interest, D. The only drawback is there can be a LOT of numbers to add (77 in this case), and avoiding a mistake is tedious work.
- b. Ruler Method Using an ordinary 12-inch plastic ruler, measure the length of an empty line, such as the one beginning at 2573620. (On my screen it's 7.3 inches long) Then determine the time represented by that line length by subtracting the starting time of one line from the starting time of the next one. For example, 2632920µs - 2621060µs = 11860µs. Now divide 11860µs by 7.3 inches to get 1625µs per inch, which is the scale factor.
- Note that the entire command is contained on nine full lines plus two partial lines. Measure the distance from A to the end of the first partial line (on my screen it's 0.9 inch x 1625µs /inch = 1463µs) and from the beginning of the last partial line to D (on my screen it's 1.3 inches x 1625µs /inch = 2113µs). So the total length of the command is [9 x 11860] + 1463 + 2113 = 110316µs, or simply 110ms.
- c. Start-of-Line Method This method relies entirely on the times shown at the start of each line in the waveform display. First, stretch or shrink the width of the display to try and place the first point of interest precisely at the beginning of a line, where the time is known. Scroll vertically to keep the point in sight as you keep changing display width to move it as close as possible to the start of any line. Don't worry if you can't place it exactly, just get as close as you can.
- If you look at Figure 10 you can judge from nearby ON and OFF times that we've been able to place the first point of interest within about 100µs of the start of a line. So we'll say the command starts at about 2548240µs.
- Now find the second point of interest and likewise adjust the display to place it at the start of a line.
- In Figure 11 we were able to place the second point of interest fairly close to the start of a line, so we'll say the command ends at about 2658320µs. (NOTE: The point is actually a little beyond the start of the line, about half the width of one of those 610µs OFF times in the line above. If that bothers you, just add 300µs to the ending time, making it 2658620µs. instead of 2658320µs.)
- Subtracting 2548240µs from 2658320µs (or 2658620µs) gives 110ms as the length of the command. This method may give an error of as much as 1ms because of the difficulty of placing events precisely at the start of a line, but that amount of error is negligible when working with infrared signals.
ADDING NOTES TO YOUR DATA
The decode entry identifies a recorded button accurately, but a description such as "NEC1 Device 4 OBC 2 Hex BF" might not be of much help if you're searching for a particular recording you may have made a day or week ago. You can avoid this problem by adding descriptive information to a saved waveform easily.
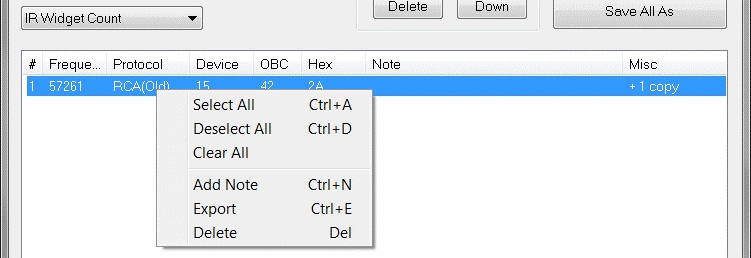
Right-click on a selected (highlighted) entry in the decode area to drop down a menu, then Click on Add Note, to open the Decode Note Editor box.
Type your note in the box. The note can be as long as you want, but for practical reasons it is recommended you limit it to what you will be able to see in the limited width of the Note column in the decode area.
If all of your note is not visible you can make the Note column wider by sliding the Misc column to the right until its right edge is just off-screen.
Be sure to save the recording AFTER adding or modifying a note, if you want the note to be part of the saved data.
KEEPING UP-TO-DATE WITH IRSCOPE
The JP1 Forum is where IRScope software is maintained, including periodically releasing new protocols, tracking down bugs, etc. Registration is free, and entitles you to post questions regarding not only AIRWidget applications, but infrared control technology in general. You can also freely download any of the vast collection of data files, instructions, etc. from the site. There are many experts available to respond to your questions and offer advice. You can join by going HERE.
BUILDING AN AIRWIDGET
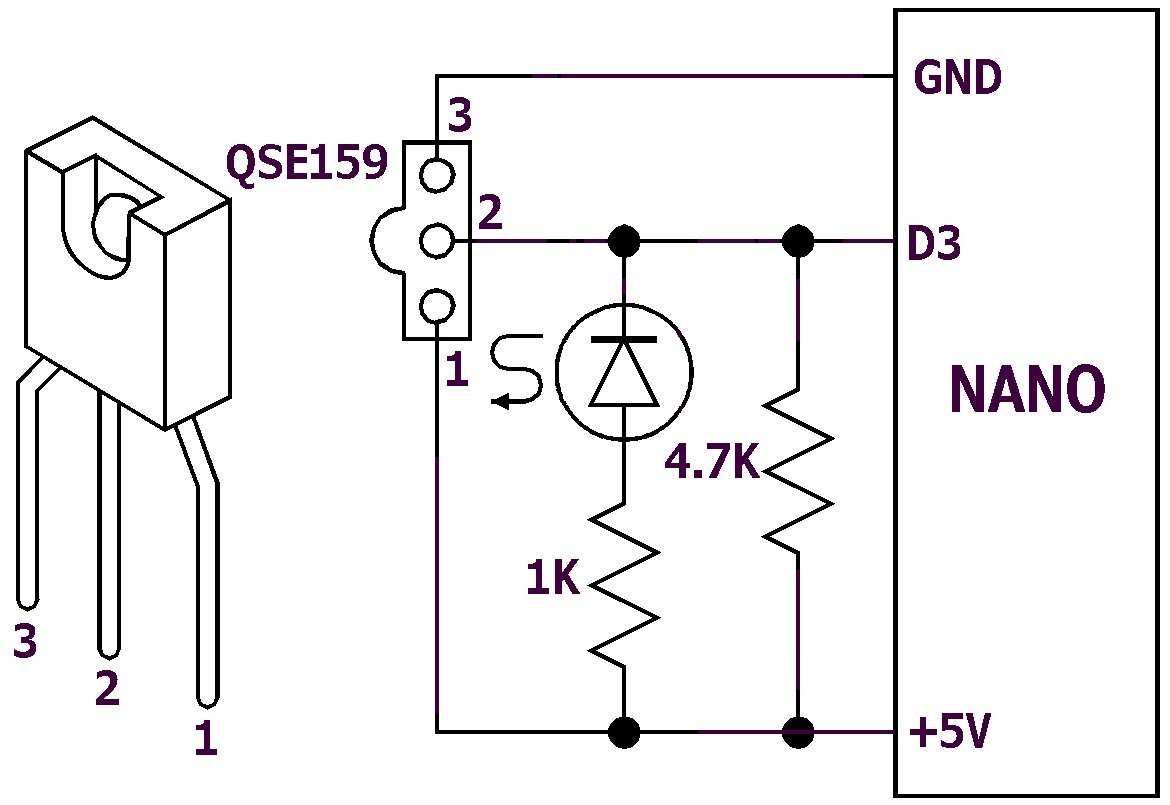
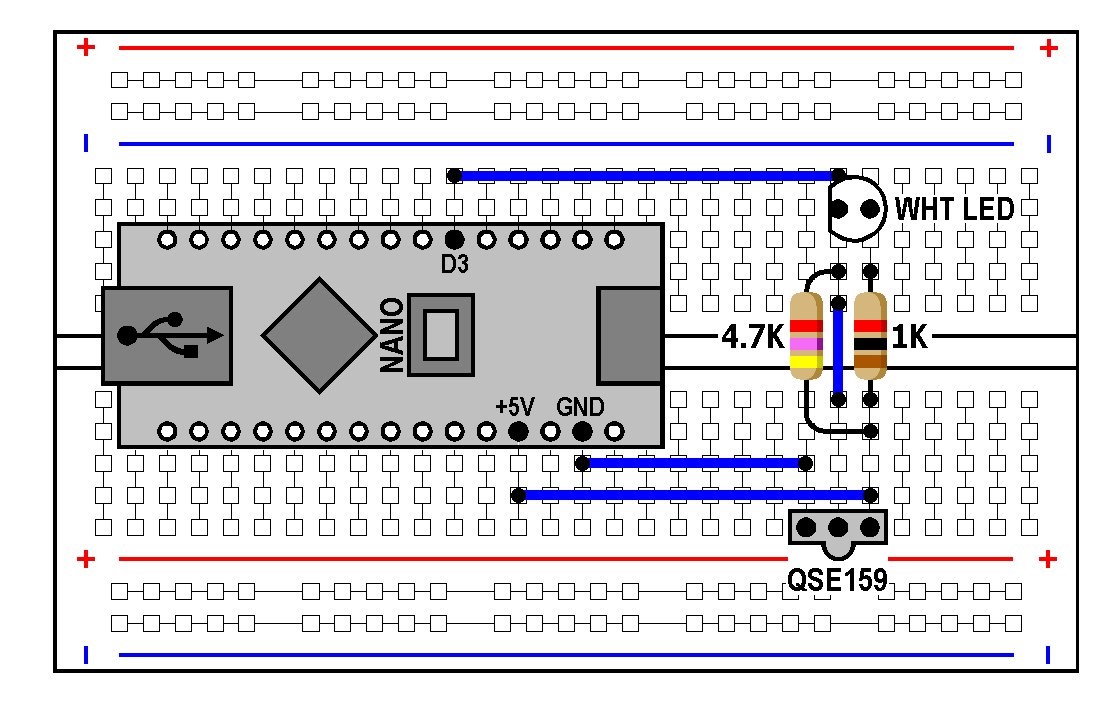
To appreciate the simplicity of the AIRWidget, take a look at its schematic (Figure 12). The main component is the Arduino Nano Microcomputer board. If you are familiar with the Nano you may notice that we use only three of its 30 pins, and you may think the board is over-qualified for the job. However, it was chosen because it is one of the least expensive and smallest microcomputer boards made. When you shop around for this component remember that an AIRWidget works just as well with Chinese clones of the Nano, most of which use a CH340 UART instead of the much more expensive FTDI brand.
AIRWidget parts are available from electronics distributors such as Mouser and DigiKey as well as on-line from Amazon, eBay, and other sources. The simplest form of AIRWidget can be made using a solderless breadboard, which is fast and easy because it does not require the use of a soldering iron
A key component of the AIRWidget is the QSE159 optical sensor. This 3-pin IC, about the size of a TO92 transistor, combines a very fast photo diode, a high-gain amplifier, a band-pass filter, and an output driver in an infrared-transparent, daylight-opaque package. Its function is to count each carrier cycle of a remote's infrared emitter as it outputs the bursts of IR carrier whose timing encodes the data bits of the transmitted message. The AIRWidget sends a running total of the count to your PC over its USB connection at precise 100 uS intervals.
There are at least three different sizes of Solderless breadboards: The full size, which is 6-1/2 inches long and has over 800 points; The half-size, which has 400 or more points; And the mini, which has 130 or more points. If you already own a half-size solderless breadboard, Figure 13 shows how you can use it. The four jumper wires should be solid 20 or 22 gage, insulated or non-insulated. This breadboard is fine for a quick-and-dirty trial, but is more than you need if you want to minimize the size of your AIRWidget or package it in a small box.
A smaller AIRWidget can be built using a Mini Solderless Breadboard (Figure 14). These are sold as single units or in packs of five to eight units by Sparkfun, Adafruit, Pololu, Amazon, eBay, and other internet sources.
Note that two of the wire jumpers are located beneath the Nano. If you want to put the AIRWidget in a box you will find several sources of small plastic boxes on the internet, usually sold in small bunches. You will have to use one that has inside dimensions of at least 1.5 " x 1.9" x .75" height. Most mini's have hooks on two sides for linking multiple units together. You can reduce the overall length and width another 0.1" if you have trouble fitting it within a box by cutting these off or filing them down.
INSTALLING THE FIRMWARE IN YOUR PC
There are three software files that must be installed in your PC before you can use an AIRWidget.
(1) Arduino IDE 1.8.13 or 1.8.19. This is a sort of “do it all” software tool that can be used to create, edit, debug, compile, and upload sketches to an Arduino product, such as the Nano. We use it only to upload the sketch. It is possible you already have it installed in your PC. If so, skip to paragraph (2). If not, search for it online and follow the instructions given for downloading and installing it.
(2) AIRWidget v1.00. This is the sketch you must upload into the Nano using the IDE. With the IDE installed, go HERE to get started. Download the AIRWidget sketch and use IDE to upload it to the Nano. Click on Tools to drop down a menu box, and make sure the following selections are listed.
(3) IRScope v3.05. This is the program you must install in your PC.
- Go HERE
- Click on the Download button.
- Click on the Extract all button.
- Enter your Arduino folder as destination for the extracted files.
- Make a shortcut that opens IRScope.exe in the Arduino folder.
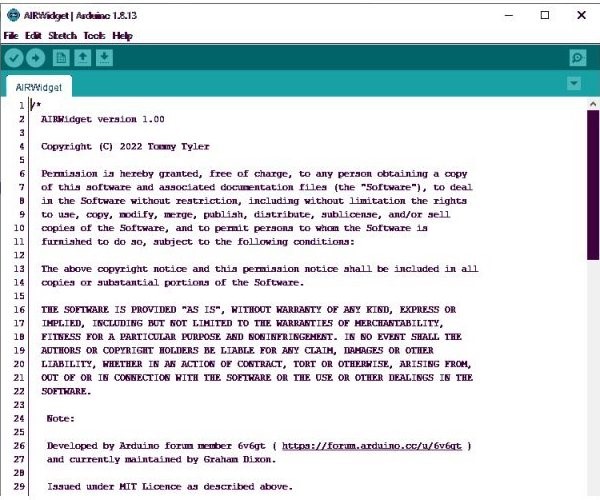
Figure 15 shows the first 29 lines of the 182-line sketch. It has long been my wish that we could simplify this wonderful system that Kevin Timmerman gave us so many years ago for collecting data with an IR Widget. I owe an enormous debt of gratitude to two people who made that possible:
- a member of the Arduino Forum known only as 6v6gt, who programmed the sketch for the AIRWidget; and
- a member of the JP1 Forum known as mathdon (Graham Dixon), who updated IRScope software as needed to maintain compatibility with old hardware as well as the new AIRWidget.

